
WORLDVIEW AEGIS | AHSAM
The Algeria–UAE Rupture: A Rivalry That Could Destabilize North Africa and the Sahel

OCT 24, 2026
AEGIS | AHSAM Regional Analysts
Regional Security & Stability Desk

On 10 September, Algeria severed diplomatic relations with the United Arab Emirates (UAE). The rupture is the product of a long strategic divergence. It is not a sudden event. A direct clash is unlikely. The main risk is indirect entanglement through local crises.
Iran’s Axis of Resistance: From Forward Defence to Direct Deterrence
OCT 22, 2026
AEGIS | AHSAM Regional Analysts
Middle East Desk
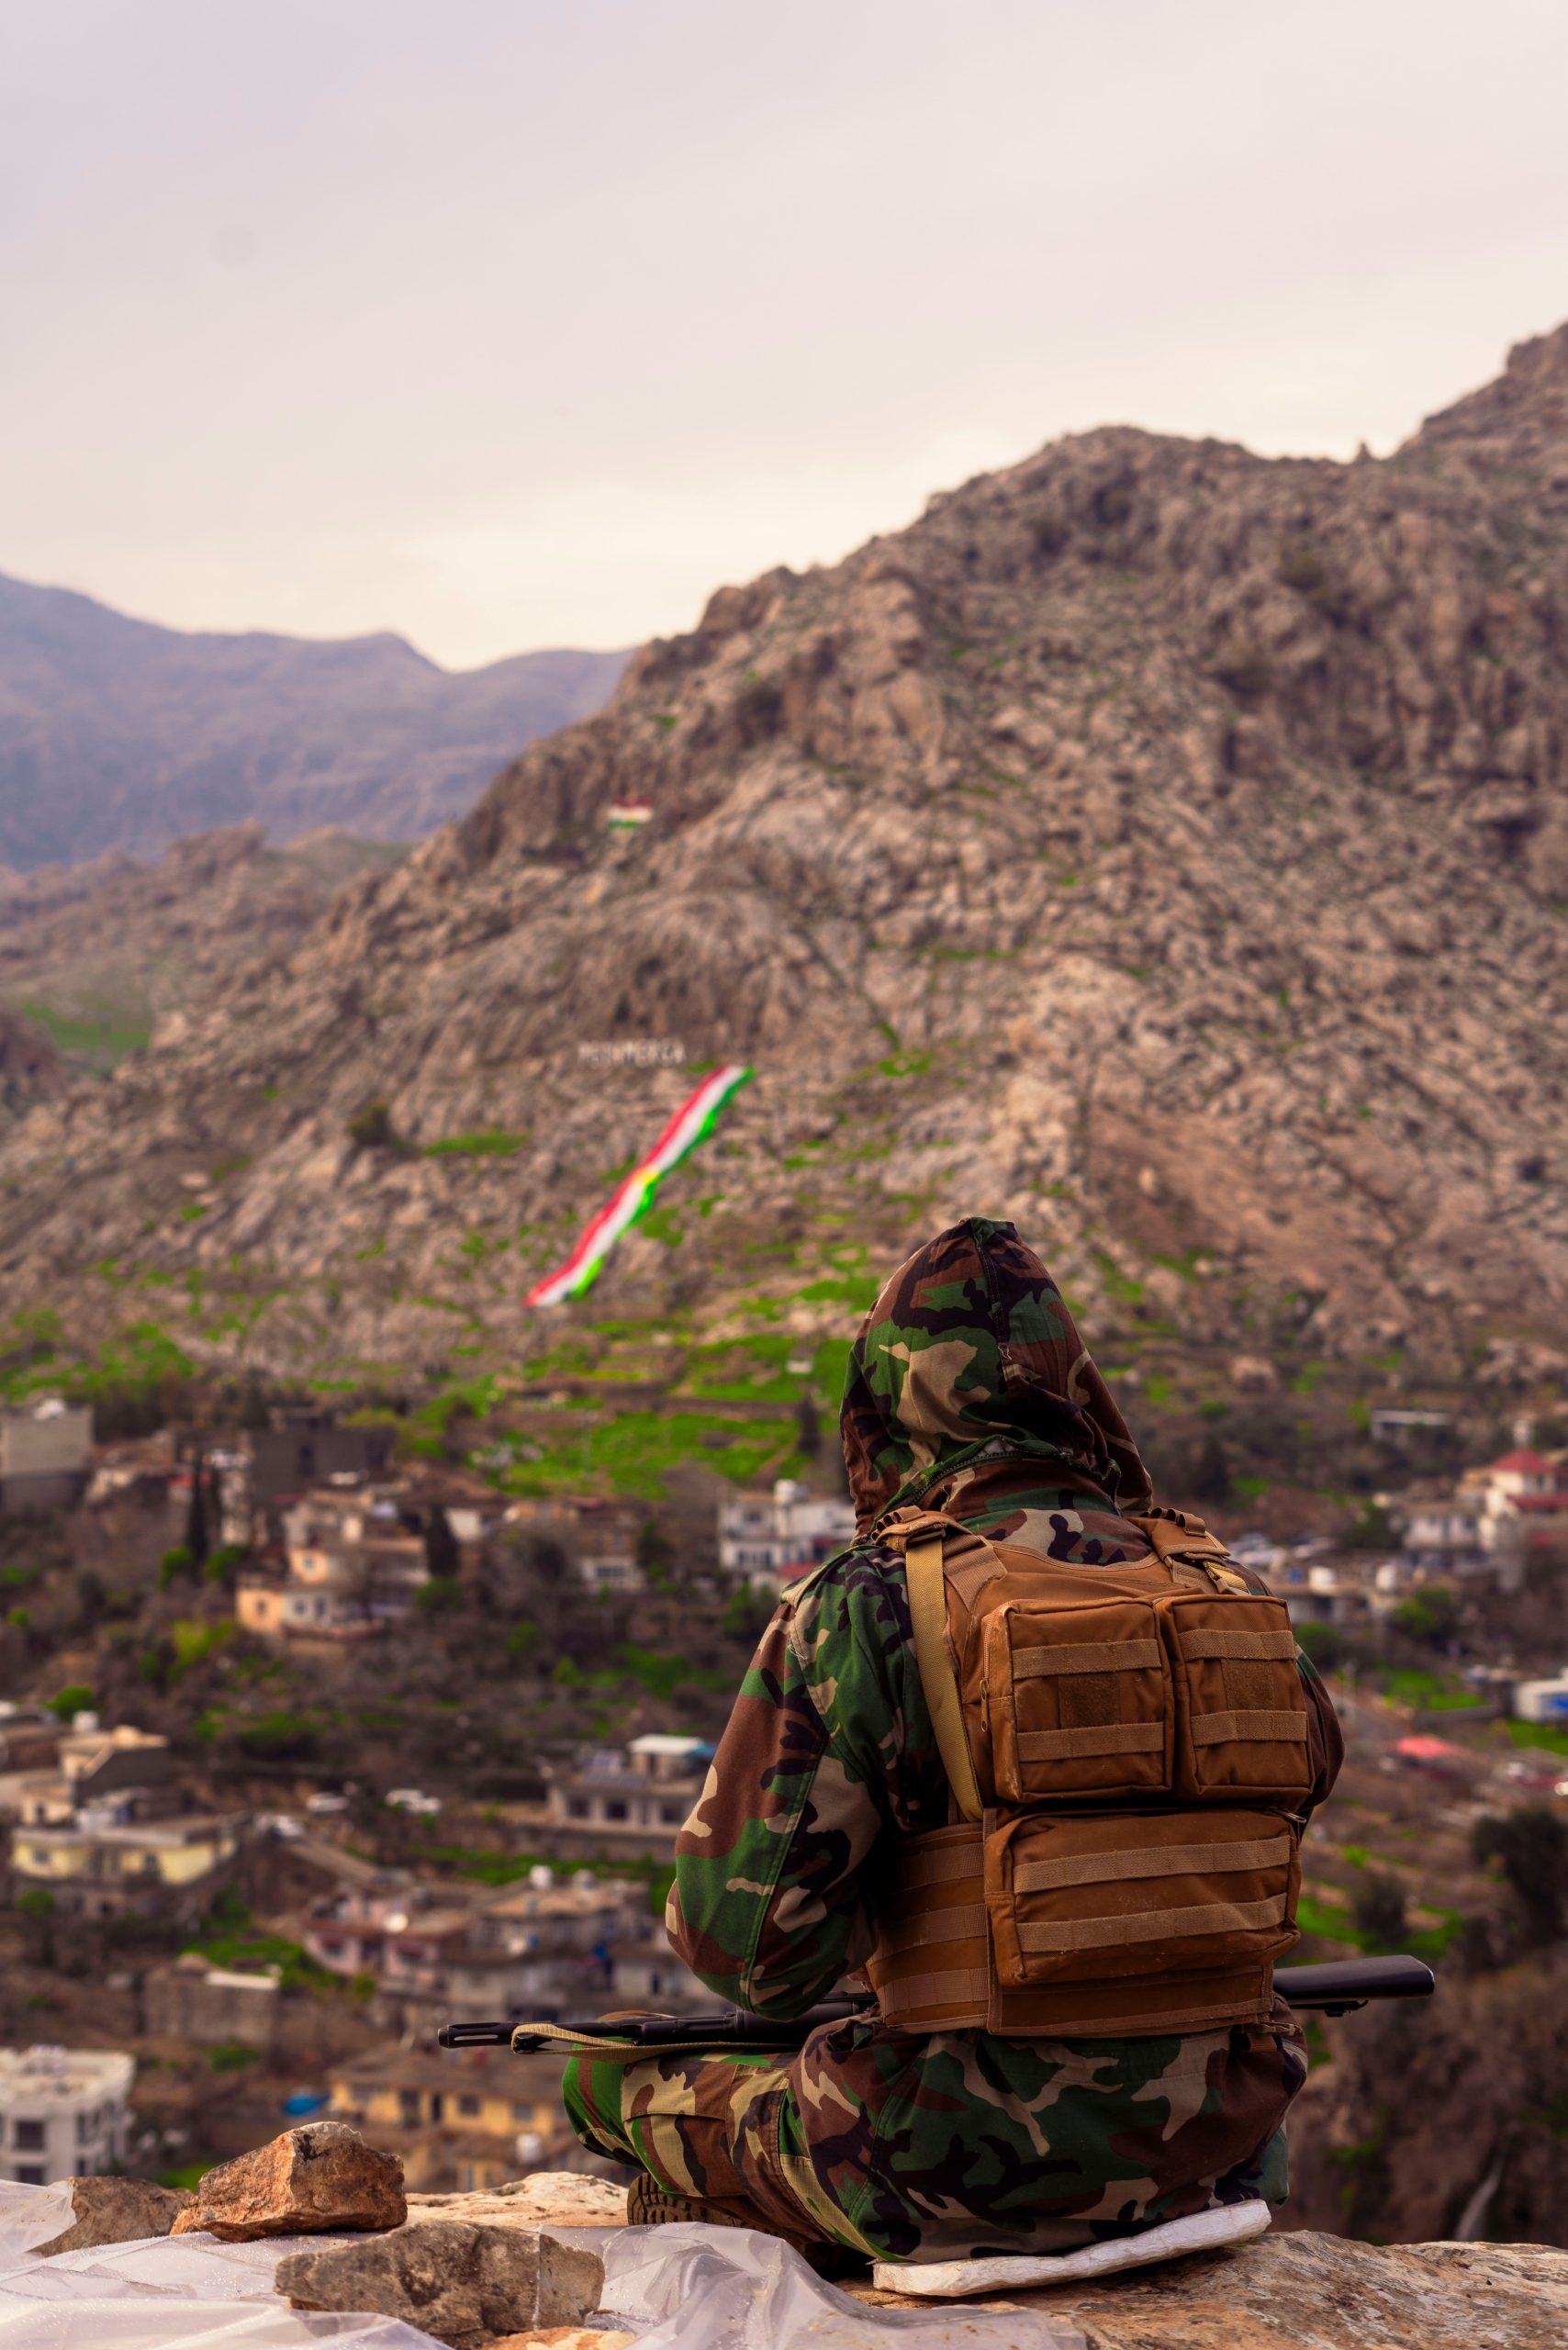
Iran no longer relies mainly on regional partners for deterrence. Israeli pressure on Hamas and Hizbollah, the fall of the Assad regime and the war with the United States and Israel since February have changed this. Tehran now gives more weight to missiles, drones and its leverage over the Strait of Hormuz. The axis remains useful, but its functions differ. The Houthis have gained value. Smaller Iraqi cells are replacing large factions in military roles. Hizbollah is weaker, yet Iran is more willing to defend it. Iran’s strategic centre of gravity has moved from the Levant to the maritime routes of the Gulf and the Red Sea. The network is more fragmented. Local autonomy is higher, while Tehran controls selected cells more tightly. Weaker partners are unlikely to reduce Iran’s exposure to conflict. They may draw it in.
The Far Right in Germany: A Representation Crisis of Liberal Democracy
OCT 03, 2026
AEGIS | AHSAM Regional Analysts
Regional Security & Stability Desk

The far right is often explained through single crisis moments. These include the post-9/11 rise of Islamophobia, the 2008 financial crisis, the 2015–2016 migration wave and the pandemic. These crises are better read as catalysts. They make an existing structural strain visible. They are not the root cause. The far right is a result, not a cause. It follows a weakening in the ability of liberal democracies and traditional political actors to produce representation and legitimacy. Postliberalism appears here as a line of challenge and reaction. It favors popular sovereignty over liberal pluralism. It ranks individual rights below collective identity. It prefers civilizational or national particularism to universalism. It stresses direct popular will over institutional checks. The left also pursues forms of this challenge.
Ten Challenges for the UN in 2026–2027: Institutional Strain and Limited Leverage
SEP 21, 2026
AEGIS | AHSAM Regional Analysts
Multilateral Diplomacy Desk

As the 2026 General Assembly opens, the United Nations is under severe financial and political strain. The United States has paid only part of the nearly USD 4 billion in dues it owes. The Secretariat's 2026 budget fell by almost 15 per cent, and its staff by 19 per cent. The Security Council remains stalled on the most salient crises, including the US-Israeli war with Iran, Ukraine and Sudan. Secretary-General António Guterres leaves office at the end of December. The five permanent members will likely decide who succeeds him. A new Secretary-General is unlikely to remove the UN's structural constraints. That person can, however, redirect the organisation toward peacemaking and conflict management.
E1 and the Price of Inaction: Testing European Leverage in the West Bank
SEP 9, 2026
AEGIS | AHSAM Regional Analysts
Middle East & Europe Desk

On 18 August 2026, Israel's Ministry of Housing issued a tender for 1,234 housing units in E1, a corridor between Jerusalem and Ma'ale Adumim in the occupied West Bank. Because E1 sits at the narrowest point of the territory, built-up construction there would almost certainly split the West Bank into two disconnected cantons and complete a ring of settlements sealing Jerusalem off from Palestinian communities. With the Trump administration largely disengaged, responsibility for external pressure falls most heavily on European governments. The tender's 19 October bidding deadline, days before Israel's 27 October Knesset elections, is likely to narrow the window in which outside actors can still affect the project's trajectory.
The Mecca Pact: Toward a Multipolar Security Architecture in the Middle East and South Asia
The Security Gap in the Bangsamoro: Why Peace Needs Policing
SEP 4, 2026
AEGIS | AHSAM Regional Analysts
Regional Security & Stability Desk
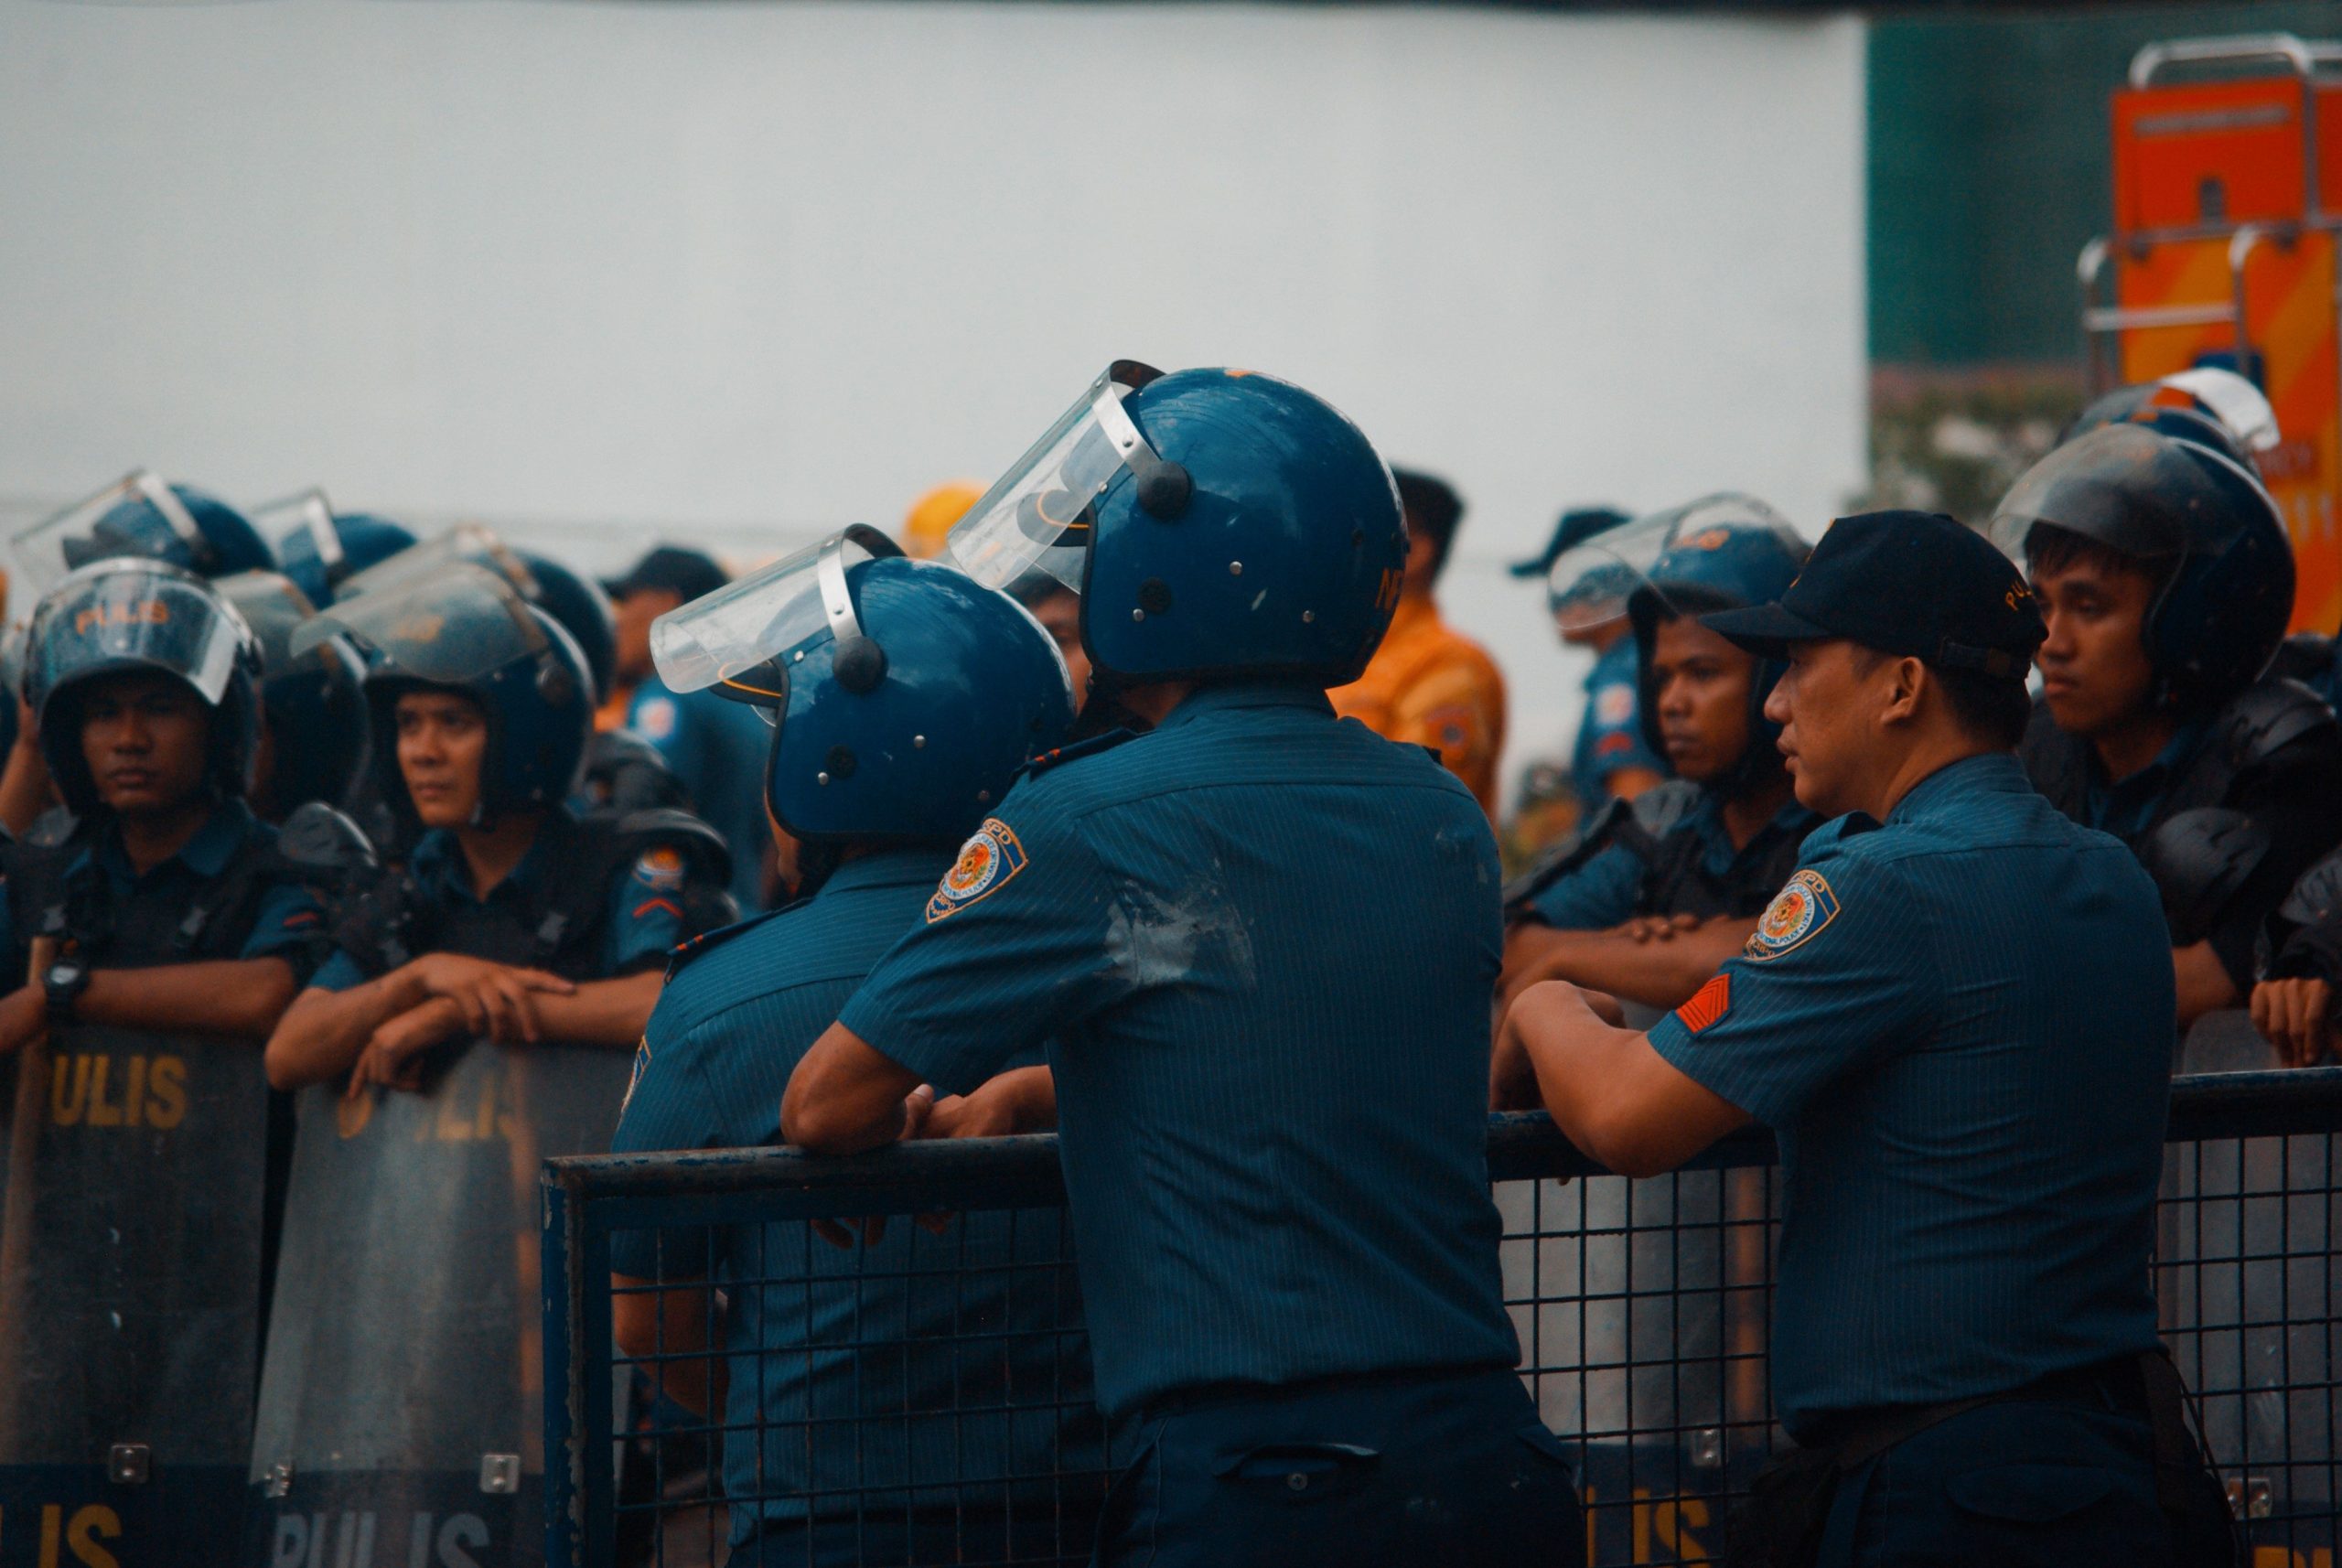
Although the 2014 peace accord ended large-scale insurgency in the Bangsamoro Autonomous Region in Muslim Mindanao (BARMM) in the southern Philippines, local security almost certainly continues to be shaped by clan feuds (rido), political rivalry, and criminal rackets — collectively described as "horizontal violence." The chronic under-capacity of the regional police force means the military remains the de facto lead security actor.Violence is likely to increase in the run-up to the September 2026 regional elections, driven by both the abundance of firearms and a leadership split within the Moro Islamic Liberation Front (MILF). Absent police reform, better military-police coordination, improved access to justice, and tighter firearms control, a recurring cycle of localized violence is likely to persist over the near-to-medium term.
Why the CIA Director Went to Moscow
Russia's Rassvet Constellation: From Experimental Prototype to Contested LEO Broadband Program
AUG 26, 2026
AEGIS | AHSAM Regional Analysts
Cyber & Critical Infrastructure Security Program

Open-source and official Russian reporting current as of August 2026 indicates that Bureau 1440's Rassvet low-Earth-orbit satellite system has entered production-phase deployment nearly a year behind its own original schedule, with an initial operational constellation of roughly 31 satellites now generating documented military-relevant capability well before the network's stated 2027 commercial broadband launch.Official Russian statements and open-source satellite tracking, current as of August 2026, indicate that Bureau 1440's Rassvet network has moved from a multi-year experimental phase (2023–2024) into serial production, with two batches of 16 satellites launched in March and July 2026 from Plesetsk Cosmodrome.
The Global Nuclear Energy Resurgence: Drivers, Distribution, and Proliferation Risk
AUG 24, 2026
AEGIS | AHSAM Regional Analysts
Analytic reformatting of Council on Foreign Relations reporting
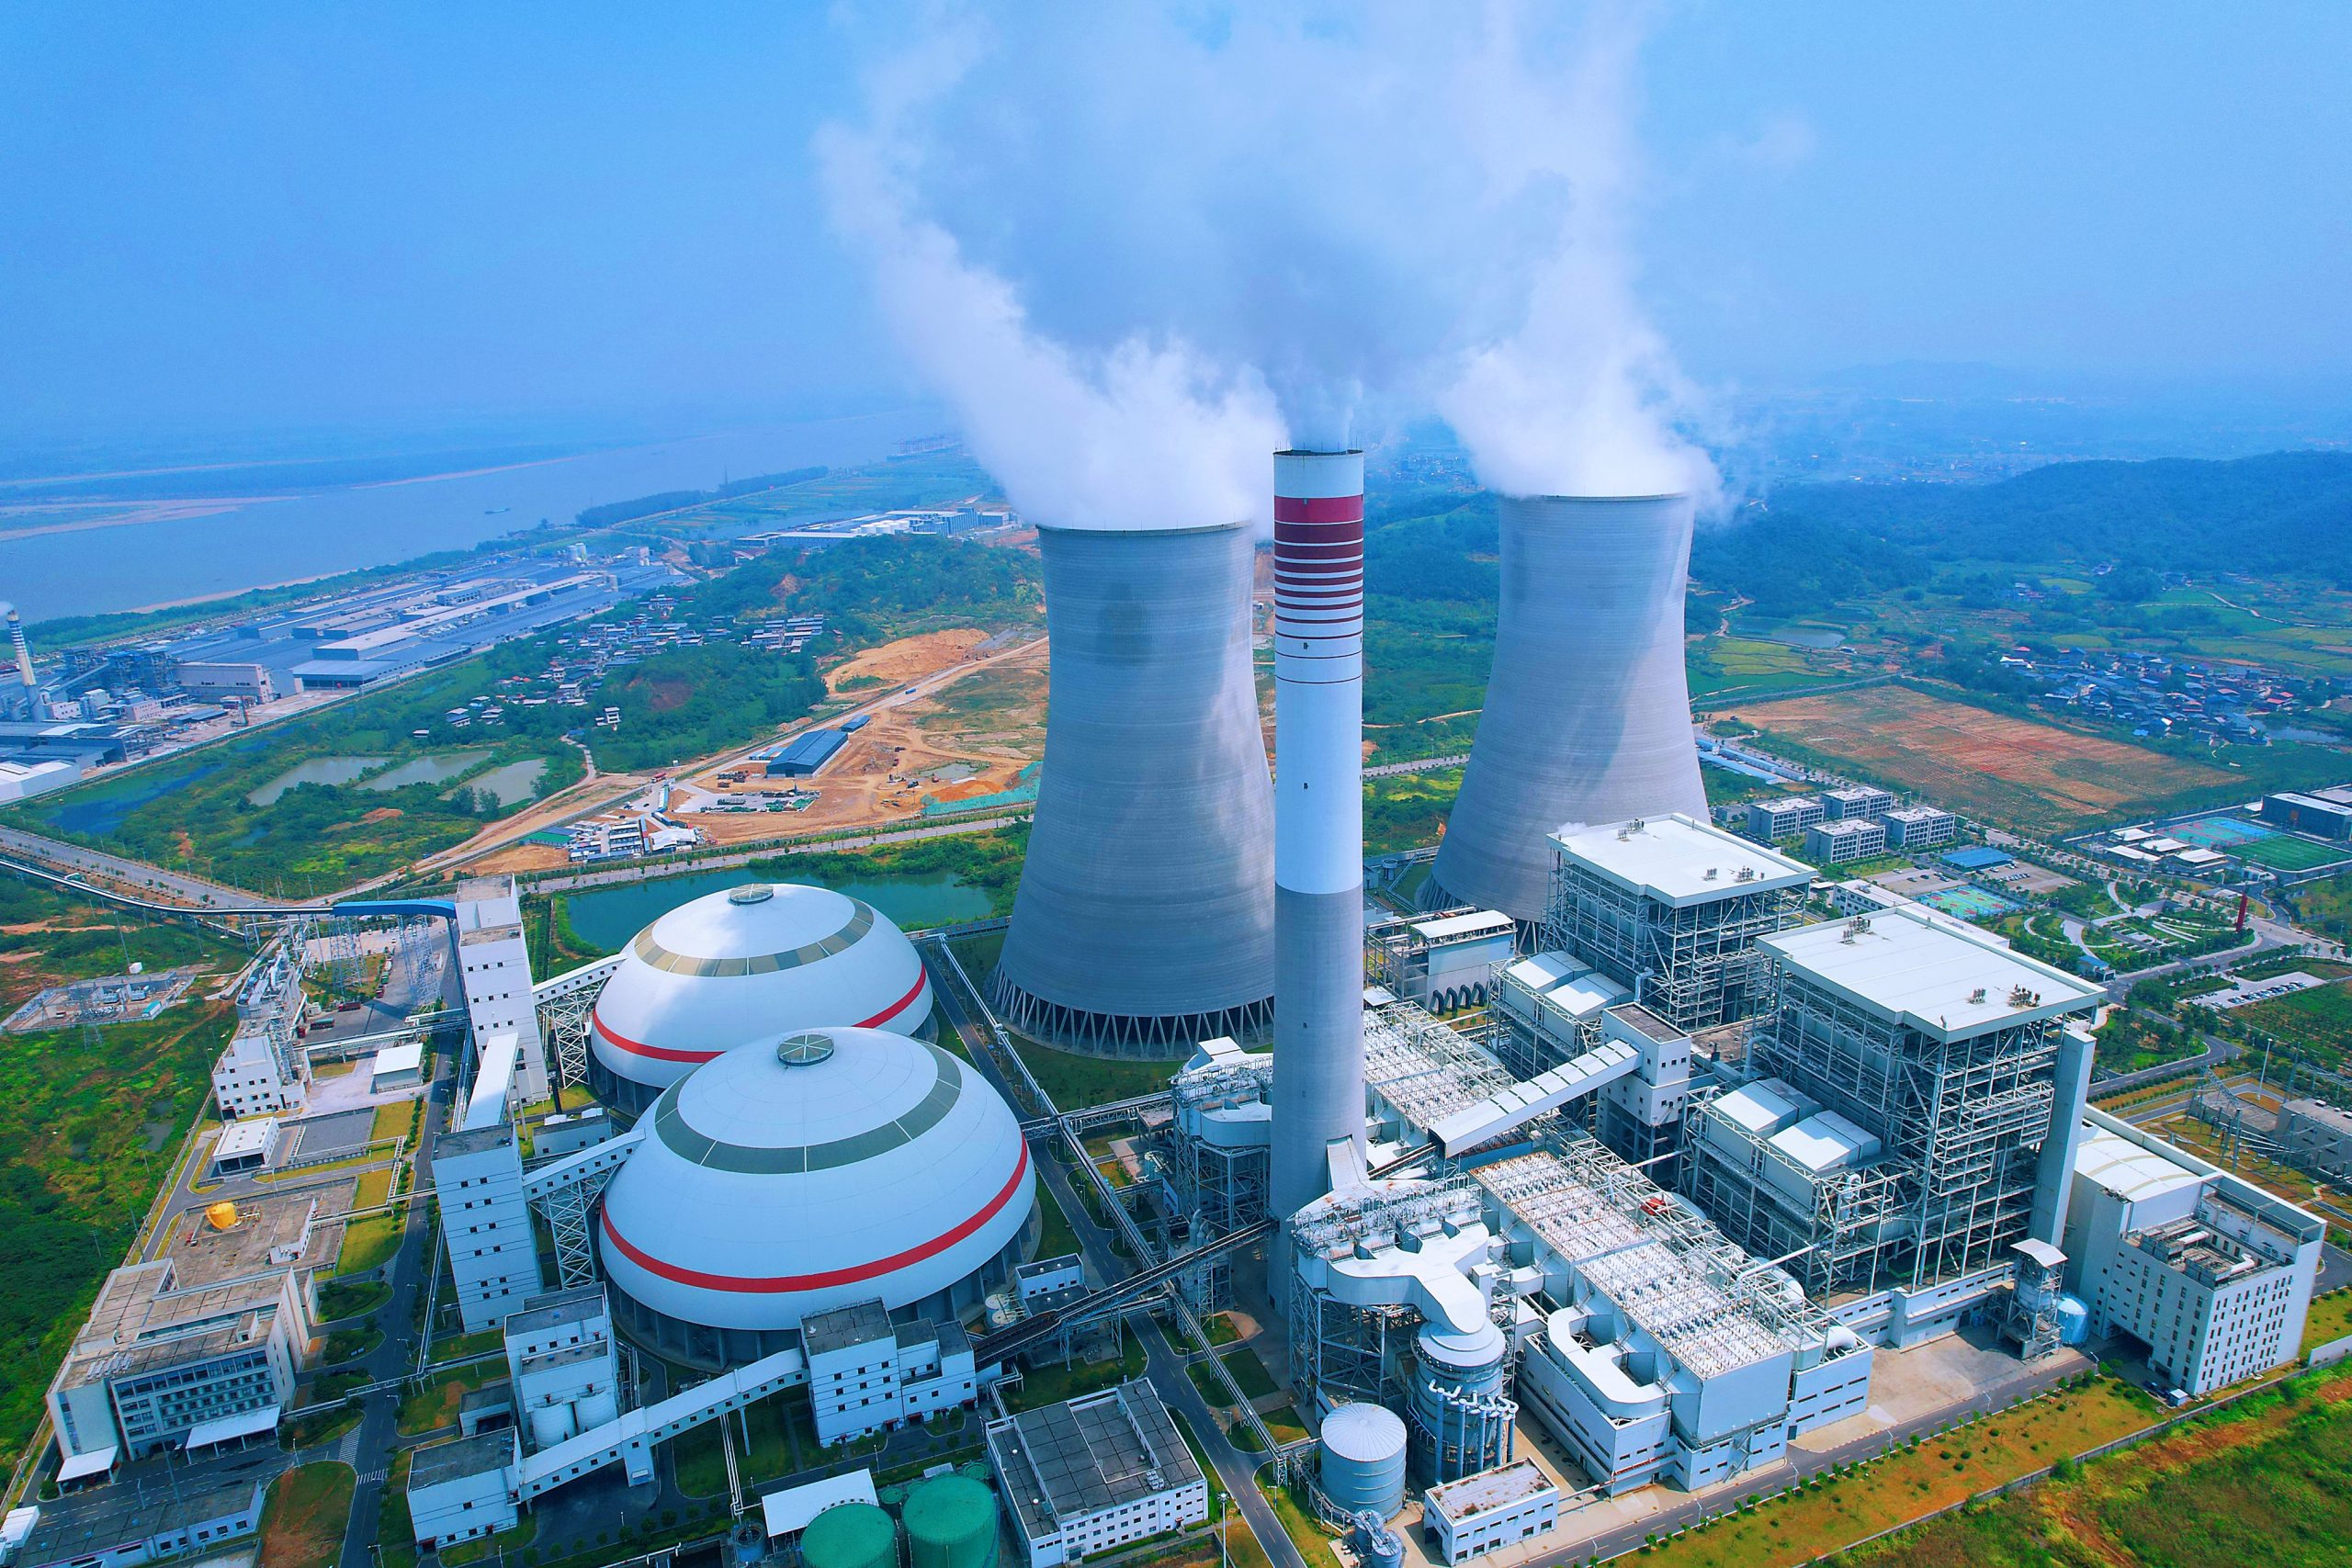
Nuclear energy is undergoing its most significant period of global expansion in several decades, propelled by the convergence of energy-security anxieties, decarbonization commitments, and surging electricity demand from artificial-intelligence infrastructure.
Libya's Power-Sharing Gamble: Assessing the U.S.-Backed Unification Initiative
AUG 22, 2026
AEGIS | AHSAM Regional Analysts
Analytic reformatting of International Crisis Group reporting
Washington is pressing forward with a power-sharing initiative aimed at merging Libya's two rival executives, led by U.S. envoy Massad Boulos. We assess that institutional reunification remains a worthwhile objective in principle, but that the deal's secrecy and its most contested reported provision — elevating Saddam Haftar, son of eastern strongman Khalifa Haftar, to head of state — risk unsettling rather than consolidating Libya's fragile post-2020 calm if concluded without broader domestic buy-in.
Yemen's War Is Returning: Assessing the Risk of a Wider Conflict
AUG 22, 2026
AEGIS | AHSAM Regional Analysts
Middle East & Conflict Analysis Program

Yemen is sliding back toward war. Fighting between the Houthi movement and government-aligned forces has intensified along the main front lines, while the Houthis and Saudi Arabia exchange regular fire across the border and at sea. We assess that a return to comprehensive war is not the most likely near-term path, but that the risk has risen materially since early August, and that a revival of substantive negotiation remains within reach if de-escalatory steps are taken without delay.
Europe's Electrolyzer Overcapacity Amid Stagnant Hydrogen Demand
Industry reporting current as of August 2026 indicates that European electrolyzer manufacturers retain sufficient annual production capacity to satisfy near-term hydrogen equipment orders, while a persistent shortfall of investable, final-investment-decision-ready hydrogen projects is leaving that manufacturing base structurally underutilized and placing the bloc's 2030 deployment targets at risk.
Europe's Electrolyzer Overcapacity Amid Stagnant Hydrogen Demand
Europe's installed electrolyzer manufacturing base of 8.49 gigawatts per year comfortably exceeds current equipment demand, yet only 3 of the 31 gigawatts of green hydrogen capacity targeted for 2030 have reached a final investment decision — a gap that, absent accelerated project financing, risks converting today's manufacturing surplus into constrained capacity later this decade.
Assessment Summary
Industry tracking of Europe's hydrogen sector, current as of August 2026, indicates that the continent's electrolyzer manufacturing base — 8.49 gigawatts of annual capacity — is sufficient to meet near-term equipment orders and is not, at present, a constraint on the wider hydrogen buildout. We assess with high confidence that the binding constraint on Europe's 2030 hydrogen ambitions is project-side rather than manufacturing-side: of 31 gigawatts of green hydrogen capacity planned for 2030, only 3 gigawatts — roughly one-tenth — has reached a final investment decision. We assess with moderate confidence that this financing gap, if unresolved, would leave electrolyzer plants underused through the remainder of the decade even as it simultaneously threatens a manufacturing shortfall from 2029 onward should project financing accelerate sharply and unevenly.
Manufacturing capacity is not the constraint on near-term hydrogen deployment: at 8.49 GW/year — a figure that includes a currently hibernated 500 MW/year facility operated by Topsoe in Denmark — European electrolyzer producers can satisfy expected orders through approximately 2028 without additional capital investment in manufacturing lines.
Project financing, not engineering capability, is the principal bottleneck: only 3 GW of the 31 GW planned for 2030 has cleared final investment decision, indicating that the majority of announced pipeline remains exposed to production-cost, offtake, and regulatory uncertainty rather than technical or manufacturing risk.
Of 624 hydrogen projects tracked across Europe between 2020 and 2026, 59 are operational and 74 have been canceled — a cancellation rate exceeding the number currently in production, consistent with an industry in which early-stage project attrition remains substantial relative to completions.
Project pipelines are geographically concentrated: the United Kingdom (130 projects, 8% under construction or expected to begin) and Germany (87 projects, 23% under construction or expected to begin) hold the largest national portfolios, with Germany showing a markedly higher share of projects advancing toward construction than the United Kingdom.
Whether accelerated final-investment-decision activity from 2027 onward would trigger a genuine manufacturing shortfall by 2029, as opposed to a more gradual capacity adjustment, cannot be established from current pipeline data alone and would require closer tracking of manufacturer expansion announcements against confirmed project financings.
Reference Diagram: Manufacturing Capacity Against the 2030 Deployment Target
Baseline Profile, by National Project Portfolio
Status Distribution: 624 Tracked Hydrogen Projects, Europe, 2020–2026
Comparative Capacity Snapshot
Source Material Referenced by This Assessment
Europe's Electrolyzer Manufacturers Face Underused Capacity as Investable Hydrogen Projects Lag
The source material analyzed for this assessment comprises trade-body reporting on Europe's hydrogen equipment manufacturing base and project pipeline, published in August 2026, covering annual electrolyzer manufacturing capacity, planned and financed capacity toward the 2030 target, and the status distribution of 624 hydrogen projects tracked across the continent since 2020.
The reporting finds that Europe's 8.49 GW/year of electrolyzer manufacturing capacity is sufficient to meet near-term equipment orders, but that only 3 GW of the 31 GW targeted for 2030 has reached final investment decision, with production costs, subdued demand, regulatory uncertainty, and a shortage of long-term offtake agreements cited as the principal constraints on project financing.
National portfolio data show the United Kingdom and Germany as the two largest markets by project count, while regional detail on Spain and Scandinavia illustrates substantial variation in how far individual pipelines have progressed beyond the feasibility stage.
Reporting period: August 2026
Official & Open-Source Source Panel
AEGIS I AHSAM Research & Advisory Team
Internal analytic compilation
Primary source for the capacity, pipeline, and project-status figures compiled and cross-referenced in this assessment.
Energy Industries Council (EIC)
eic.co.uk
Trade association reporting on European electrolyzer manufacturing capacity, project final-investment-decision status, and national pipeline data referenced in this assessment.
EIC DataStream
Industry project database
Underlying project-tracking dataset covering hydrogen project counts, status classifications, and capital-expenditure estimates across European markets.
European Commission — REPowerEU
energy.ec.europa.eu
Reference framework for the European Union's 2030 renewable-hydrogen production and import targets against which project financing progress is measured.
Hydrogen Europe
hydrogeneurope.eu
Cross-reference on sector-wide investment climate, offtake-agreement trends, and manufacturer sentiment relevant to the financing-gap findings above.
AEGIS Concurrent European Energy Security Reporting
Internal cross-reference
AHSAM's ongoing coverage of European industrial-energy and clean-technology investment trends provides the regional context cited in the Key Judgments above.
Indicators to Watch
Delayed Final Investment Decisions
With only 3 of 31 GW financed, a continued slow pace of final-investment-decision activity would extend the period of manufacturing underutilization and further erode 2030 deployment prospects.
Manufacturer Consolidation
The 2025 exits of electrolyzer developers Green Hydrogen Systems and McPhy, attributed to high cash burn against weak demand, signal that continued overcapacity could prompt further manufacturer attrition.
Late-Decade Capacity Reversal
Should financed projects accelerate sharply after 2027, the EIC's reporting indicates that today's manufacturing surplus could invert into a manufacturing constraint from approximately 2029, warranting continued tracking of the FID pipeline against installed capacity.
Sourcing & methodology. This assessment compiles publicly reported figures on European electrolyzer manufacturing capacity, planned and financed capacity toward the 2030 target, national hydrogen project portfolios, and project-status distribution across 624 tracked projects, current as of August 2026. The reference diagram and donut chart are original AHSAM analytic renderings of the underlying data rather than reproductions of any single source graphic. Findings are structured as a bottom-line-up-front summary with calibrated key judgments (high / moderate / low confidence) and should be read as a working analytic snapshot rather than a finalized market record.
Iranian Cyber Operations Against U.S. Water Infrastructure: Escalation or Opportunism?
AUG 17, 2026
AEGIS | AHSAM Regional Analysts
Cyber & Critical Infrastructure Security Program

A wave of cyber intrusions affecting water utilities across twelve U.S. states and roughly one hundred municipalities constitutes, in aggregate, a campaign-scale operation against domestic critical infrastructure. While formal U.S. government attribution remains pending, the available indicators converge on Iranian state-linked actors as the probable source.We assess that the intrusions are better characterized as opportunistic disruption exploiting chronic U.S. cyber vulnerabilities than as a deliberate escalatory signal in the ongoing conflict.
Religion as an Intelligence Domain: A Structural Assessment

AUG 15, 2026
Cem Atilla SAYGIN
Chief Executive Officer of AEGIS | AHSAM

Intelligence services engage foreign religious groups for three converging reasons: information collection in access-denied environments, generation of influence over population segments a state cannot otherwise reach, and logistical support for irregular or proxy conflict.These engagements cluster into six recurring categories: recruitment, covert influence, front organizations, liaison arrangements, state-sanctioned institution-building, and proxy-warfare infrastructure.
Rhine–Danube Drawdown: Germany's August 2026 River Gauge Readings
Federal river-gauge monitoring data confirm persistently low water levels across the German Rhine and Danube networks as of August 14, 2026, with two profiled stations — Worms on the Rhine and Ingolstadt on the Danube — reading below their local gauge datum, against a backdrop of comparatively strong readings at the Alpine-fed upper reaches of both rivers.
Rhine–Danube Drawdown: Germany's August 2026 River Gauge Readings
Germany's federal river-gauge network shows a mixed but broadly low-water picture on August 14, 2026: Rhine stations from Kaub to Düsseldorf cluster in the single-digit-to-low-double-digit centimeter range, Worms reads eighteen centimeters below its gauge datum, and the Danube's Ingolstadt gauge posts the network's lowest flow rate at 39 cubic meters per second — even as the Alpine-fed headwater stations at Basel and Passau remain comparatively high.
Assessment Summary
Federal river-gauge monitoring data for Germany's Rhine and Danube networks, current as of August 14, 2026, indicate that water levels across the middle and lower Rhine — from Kaub through Düsseldorf — remain in the single-digit-to-low-double-digit centimeter range, with the Worms gauge reading 18 centimeters below its local datum. We assess with high confidence that this reflects a broadly low-water condition across the Rhine's shipping-critical middle reach, and with moderate confidence that a comparable, if less pronounced, pattern is present on the profiled Danube stretch, where the Ingolstadt gauge also reads below datum and posts the network's lowest flow rate. The Alpine-fed headwater stations — Basel on the Rhine and Passau on the Danube — remain the two highest readings in the network, indicating the drawdown is concentrated in the middle reaches rather than uniform across either river.
Rhine water levels are broadly low across the middle and lower reaches: Andernach (1 cm), Koblenz (5 cm), Kaub (9 cm), Düsseldorf (2 cm), and Cologne (50 cm) all sit well below the readings recorded upstream at Maxau (304 cm) and Basel (490 cm), consistent with late-summer low-flow conditions concentrated in the middle Rhine.
Two gauges in the network read below their local datum: Worms on the Rhine (-18 cm, 398 m³/s) and Ingolstadt on the Danube (-10 cm, 39 m³/s) are the clearest single-day signal of drought-stressed hydrology among the twenty stations profiled.
Flow rates on the profiled Danube stretch are markedly lower than on the Rhine: Danube stations range from 39 to 105 cubic meters per second where reported, against a 370–590 cubic meter per second range across most Rhine stations, suggesting comparatively tighter water availability feeding the profiled Danube reach.
Gauge datums vary by station, so centimeter readings are not directly comparable across stations or between the two rivers without normalization; only the sign of each reading (positive or below-datum) and the within-river trend carry meaningful cross-station significance.
Whether current readings represent a seasonal norm for mid-August or an anomalous drought signal cannot be established from a single day of gauge data and would require comparison against multi-year historical baselines for each station.
Reference Diagram: Rhine River Profile, Basel to Rees, August 14, 2026
Baseline Profile, by Gauge Station
Station Sequence: Rhine (Basel to Rees) and Danube (Ingolstadt to Passau)
GAUGE READINGS BY REACH, AUGUST 14, 2026
Comparative Gauge Snapshot, Rhine and Danube (Selected Stations)
Source Material Referenced by This Assessment
Germany: Water Levels at the Rhine and Danube Rivers, August 14, 2026
The source material analyzed for this assessment comprises same-day station-level readings from Germany's federal river-gauge monitoring network: fourteen Rhine stations from Basel to Rees, and six Danube stations from Ingolstadt to Passau, each reporting a water-level figure in centimeters and, for most Rhine stations and several Danube stations, a flow-rate figure in cubic meters per second.
The Rhine readings show a clear upstream-to-downstream pattern, opening at 490 cm at Basel and falling to a below-datum reading of -18 cm at Worms before recovering modestly through the lower reaches to 17 cm at Rees.
The Danube readings follow a comparable pattern on the reach profiled, opening below datum at -10 cm at Ingolstadt — the network's lowest recorded flow rate at 39 m³/s — and rising to 386 cm at Passau near the Austrian border.
Reading date: August 14, 2026
Official & Open-Source Source Panel
Undine River Information Platform
undine.bafg.de
Germany's federal river-level and flow-rate information platform, operated under the Federal Institute of Hydrology; primary source for the station-level readings referenced in this assessment.
Federal Waterways and Shipping Administration (WSV)
wsv.de
Operates the gauge network and fairway authority for the Rhine and Danube reaches profiled; cross-check on station locations and shipping-draft implications.
International Commission for the Protection of the Rhine (ICPR)
iksr.org
Cross-references basin-wide Rhine hydrological trends and low-water reporting relevant to the middle-Rhine readings cited above.
German Weather Service (Deutscher Wetterdienst)
dwd.de
Supplies precipitation and drought-index context for the reporting period, relevant to the Outlook section below.
International Commission for the Protection of the Danube River (ICPDR)
icpdr.org
Cross-check on basin-wide Danube flow conditions and low-water reporting for the reach profiled.
AHSAM Concurrent European Resource Security Reporting
Internal cross-reference
AHSAM's ongoing coverage of European inland-waterway and drought-risk trends provides the regional context cited in the Key Judgments above.
Indicators to Watch
Middle Rhine Shipping Constraints
Kaub, Koblenz, and Andernach readings in the single-digit-to-low-double-digit range keep the Rhine's most draft-sensitive shipping chokepoint close to levels that typically trigger barge-loading restrictions.
Two Below-Datum Gauges
Worms (Rhine) and Ingolstadt (Danube) both read below their local gauge zero; a wider spread of below-datum readings in the next reporting cycle would be a stronger drought-stress signal.
Late-Summer Drought Persistence
Precipitation outlooks from Germany's national weather service are the leading indicator for whether current low-water conditions ease or deepen through September.
Sourcing & methodology. This assessment compiles same-day (August 14, 2026) water-level and flow-rate readings from Germany's federal river-gauge monitoring network across fourteen Rhine stations (Basel to Rees) and six Danube stations (Ingolstadt to Passau), cross-referenced against basin-commission and national meteorological reporting. The reference diagram is an AHSAM analytic rendering of the station-level data rather than a reproduction of any single source graphic. Findings are structured as a bottom-line-up-front summary with calibrated key judgments (high / moderate / low confidence) and should be read as a working analytic snapshot rather than a finalized hydrological record.
After Iran: A Structured Assessment of Prospective Renewed Trump-Kim Summitry

AUG 14, 2026
Victor Cha
President, Geopolitics and Foreign Policy Department; Korea Chair, Center for Strategic and International Studies

AUG 14, 2026
AEGIS | AHSAM Regional Analysts
Korea & Northeast Asia Security Program
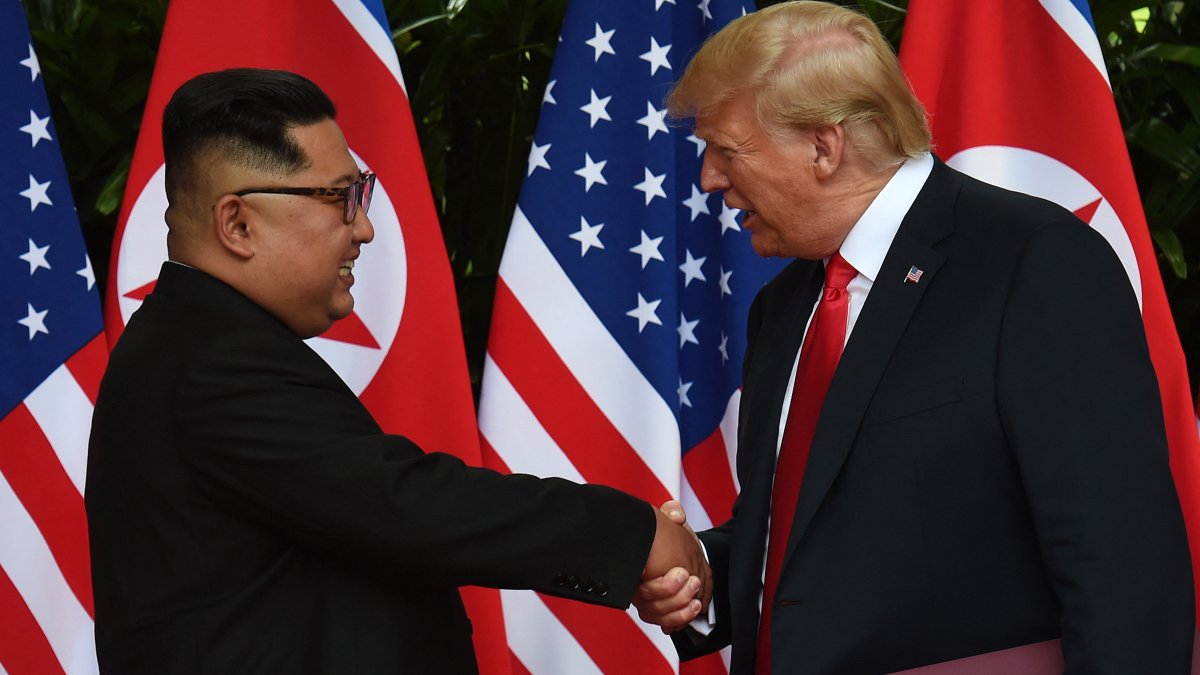
Following reported remarks to South Korean President Lee Jae Myung at the June 2026 G7 meetings, and a subsequently posted image of a stroll with Kim Jong-un at Singapore's Capella Hotel, indicators point to renewed U.S. interest in Trump-Kim diplomacy.We assess that whether Pyongyang reciprocates hinges on a single variable: whether Kim Jong-un's strategic posture is fundamentally revisionist — oriented toward consolidating de facto recognition as a nuclear weapons state — rather than status-quo oriented, as conventional analysis assumes.
Gulf Oil Rebound: OPEC's July 2026 Production Surge
OPEC Secretariat data confirm that group-wide crude oil production rose 1.659 million barrels per day month-on-month in July 2026, to 23.632 million barrels per day, driven almost entirely by a rebound across Iraq, Saudi Arabia, and Kuwait following a sharp contraction in Gulf output earlier in the year.
Gulf Oil Rebound: OPEC's July 2026 Production Surge
OPEC's July 2026 Monthly Oil Market Report shows group production climbing to 23.632 mb/d, a 1.659 mb/d month-on-month increase led by Iraq (+665 kb/d), Saudi Arabia (+590 kb/d), and Kuwait (+393 kb/d) — a rebound that follows a sharp Gulf-wide output contraction recorded across January–April 2026.
Assessment Summary
OPEC Secretariat data, published in the July 2026 Monthly Oil Market Report, indicate that group-wide crude production rose 1.659 million barrels per day month-on-month to 23.632 million barrels per day, the sharpest monthly increase of the year. We assess with high confidence that the increase is overwhelmingly concentrated in three Gulf producers — Iraq, Saudi Arabia, and Kuwait — and that it marks a partial recovery from a pronounced contraction in Gulf output recorded across January–April 2026. We assess with moderate confidence that the recovery trajectory is consistent with the gradual restoration of Gulf export capacity following the regional disruptions associated with the broader U.S.-Israel-Iran confrontation during the same window, though the July production data alone do not establish causation.
The July increase is concentrated in three Gulf OPEC members: Iraq (+665 kb/d), Saudi Arabia (+590 kb/d), and Kuwait (+393 kb/d) together account for the entirety of the group's net 1,659 kb/d gain, more than offsetting small declines from Nigeria, the UAE, Gabon, and Congo.
The rebound follows a sharp Gulf-wide contraction earlier in the year: Saudi Arabia, Iraq, Kuwait, and the UAE each show a marked decline from January 2026 levels through a trough around March–April, before output begins climbing back over May–July.
The recovery is uneven across Gulf producers: the UAE is the only profiled state whose July level exceeds its January baseline, while Saudi Arabia, Iraq, and Kuwait remain well below their respective January levels despite the July acceleration — indicating capacity restoration is still in progress rather than complete.
Iran's near-flat July change (+26 kb/d) against a backdrop of continued below-January output stands out against the much larger gains posted by Iraq, Saudi Arabia, and Kuwait, suggesting Iran's production is recovering, if at all, on a materially slower track than its Gulf Arab neighbors.
Whether the July acceleration marks the start of a sustained return toward pre-2026 Gulf production levels, or a single-month rebound within a still-volatile security environment, cannot be established from one month of OPEC data and would require confirmation from the August and September Monthly Oil Market Reports.
Reference Diagram: Gulf Oil Production Trend, January–July 2026
Baseline Profile, by Gulf Producer
Production Trajectory, January–July 2026
GULF OIL OUTPUT, SELECTED MONTHS
Comparative Production Snapshot (Open-Source, Illustrative)
Source Material Referenced by This Assessment
OPEC's Daily Crude Oil Production Increased by 1.66 Million Barrels in July
The source material analyzed for this assessment comprises two graphics: a monthly line-chart series of Gulf-country crude oil production (January–July 2026, million barrels per day) for Saudi Arabia, Iraq, Iran, the UAE, Kuwait, Oman, and Bahrain; and an OPEC Monthly Oil Market Report table listing each member's June and July 2026 daily crude output and the month-on-month change in thousand barrels.
The Gulf production chart shows Saudi Arabia opening the year at 10.8 mb/d and closing July at 7.35 mb/d, with Iraq, Kuwait, and the UAE showing comparable mid-year contractions before a partial recovery into July.
The OPEC table confirms group daily production rose 1.659 mb/d month-on-month to 23.632 mb/d in July, with Iraq (+665 kb/d), Saudi Arabia (+590 kb/d), and Kuwait (+393 kb/d) accounting for the great majority of the net increase, against smaller declines from Nigeria, the UAE, Gabon, and Congo.
Published: August 12–13, 2026
Official & Open-Source Source Panel
OPEC Secretariat — Monthly Oil Market Report
publications.opec.org/momr
Primary source for the July 2026 group production total, the member-level June-to-July change table, and the 23.632 mb/d aggregate figure underlying this assessment.
U.S. Energy Information Administration (EIA)
eia.gov
Official U.S. government cross-check on Gulf production levels and on the surplus/spare-capacity methodology used to interpret the scale of the July rebound.
International Energy Agency (IEA)
iea.org
Supplementary international cross-check on OPEC and non-OPEC supply trends and on monthly oil-market balance reporting.
National Oil Ministries & State Companies
Saudi Aramco · ADNOC · KPC · Iraq Ministry of Oil
Direct national-level production reporting for the Gulf states profiled, used to corroborate the January and July endpoint figures in the reference diagram.
Open-Source Energy Market Intelligence
Illustrative — tanker & export-flow tracking
Cross-checks monthly OPEC+ compliance and production estimates against visible tanker movements and export-flow data.
AHSAM Concurrent Gulf Security Reporting
Internal cross-reference
AHSAM's own reporting on the Strait of Hormuz and the broader U.S.-Israel-Iran confrontation provides the regional disruption context cited in the Key Judgments above.
Indicators to Watch
Sustainability of the July Rebound
Whether Iraq, Saudi Arabia, and Kuwait maintain the pace of increase in the August Monthly Oil Market Report, or the July gain proves a single-month correction, is the key near-term test of this assessment.
UAE's Marginal July Dip
A further UAE decline in the August report would be the first sign of unevenness inside an otherwise broad-based Gulf recovery, given the UAE is currently the only producer above its January baseline.
OPEC+ Spare Capacity Drawdown
Continued increases from the three largest Gulf producers would draw down the surplus capacity that has cushioned the market since the January–April 2026 contraction; spare-capacity estimates are a key indicator to monitor.
Sourcing & methodology. This assessment analyzes two OPEC-sourced production graphics — a January–July 2026 Gulf-country crude oil production chart and the OPEC Monthly Oil Market Report's June–July 2026 production table — as its primary sources. It is cross-referenced against official U.S. Energy Information Administration statistics, International Energy Agency reporting patterns, and AHSAM's own concurrent Gulf security coverage. The reference diagram in this document is an AHSAM analytic rendering rather than a reproduction of the original source graphics. Findings are structured as a bottom-line-up-front summary with calibrated key judgments (high / moderate / low confidence) and should be read as a working analytic assessment, not a finalized production record.
The Vanishing Grant: U.S.-Israel Military Assistance and the Shift Toward Strategic Integration
AUG 13, 2026
AEGIS | AHSAM Regional Analysts
Middle East Security & Foreign Assistance Program
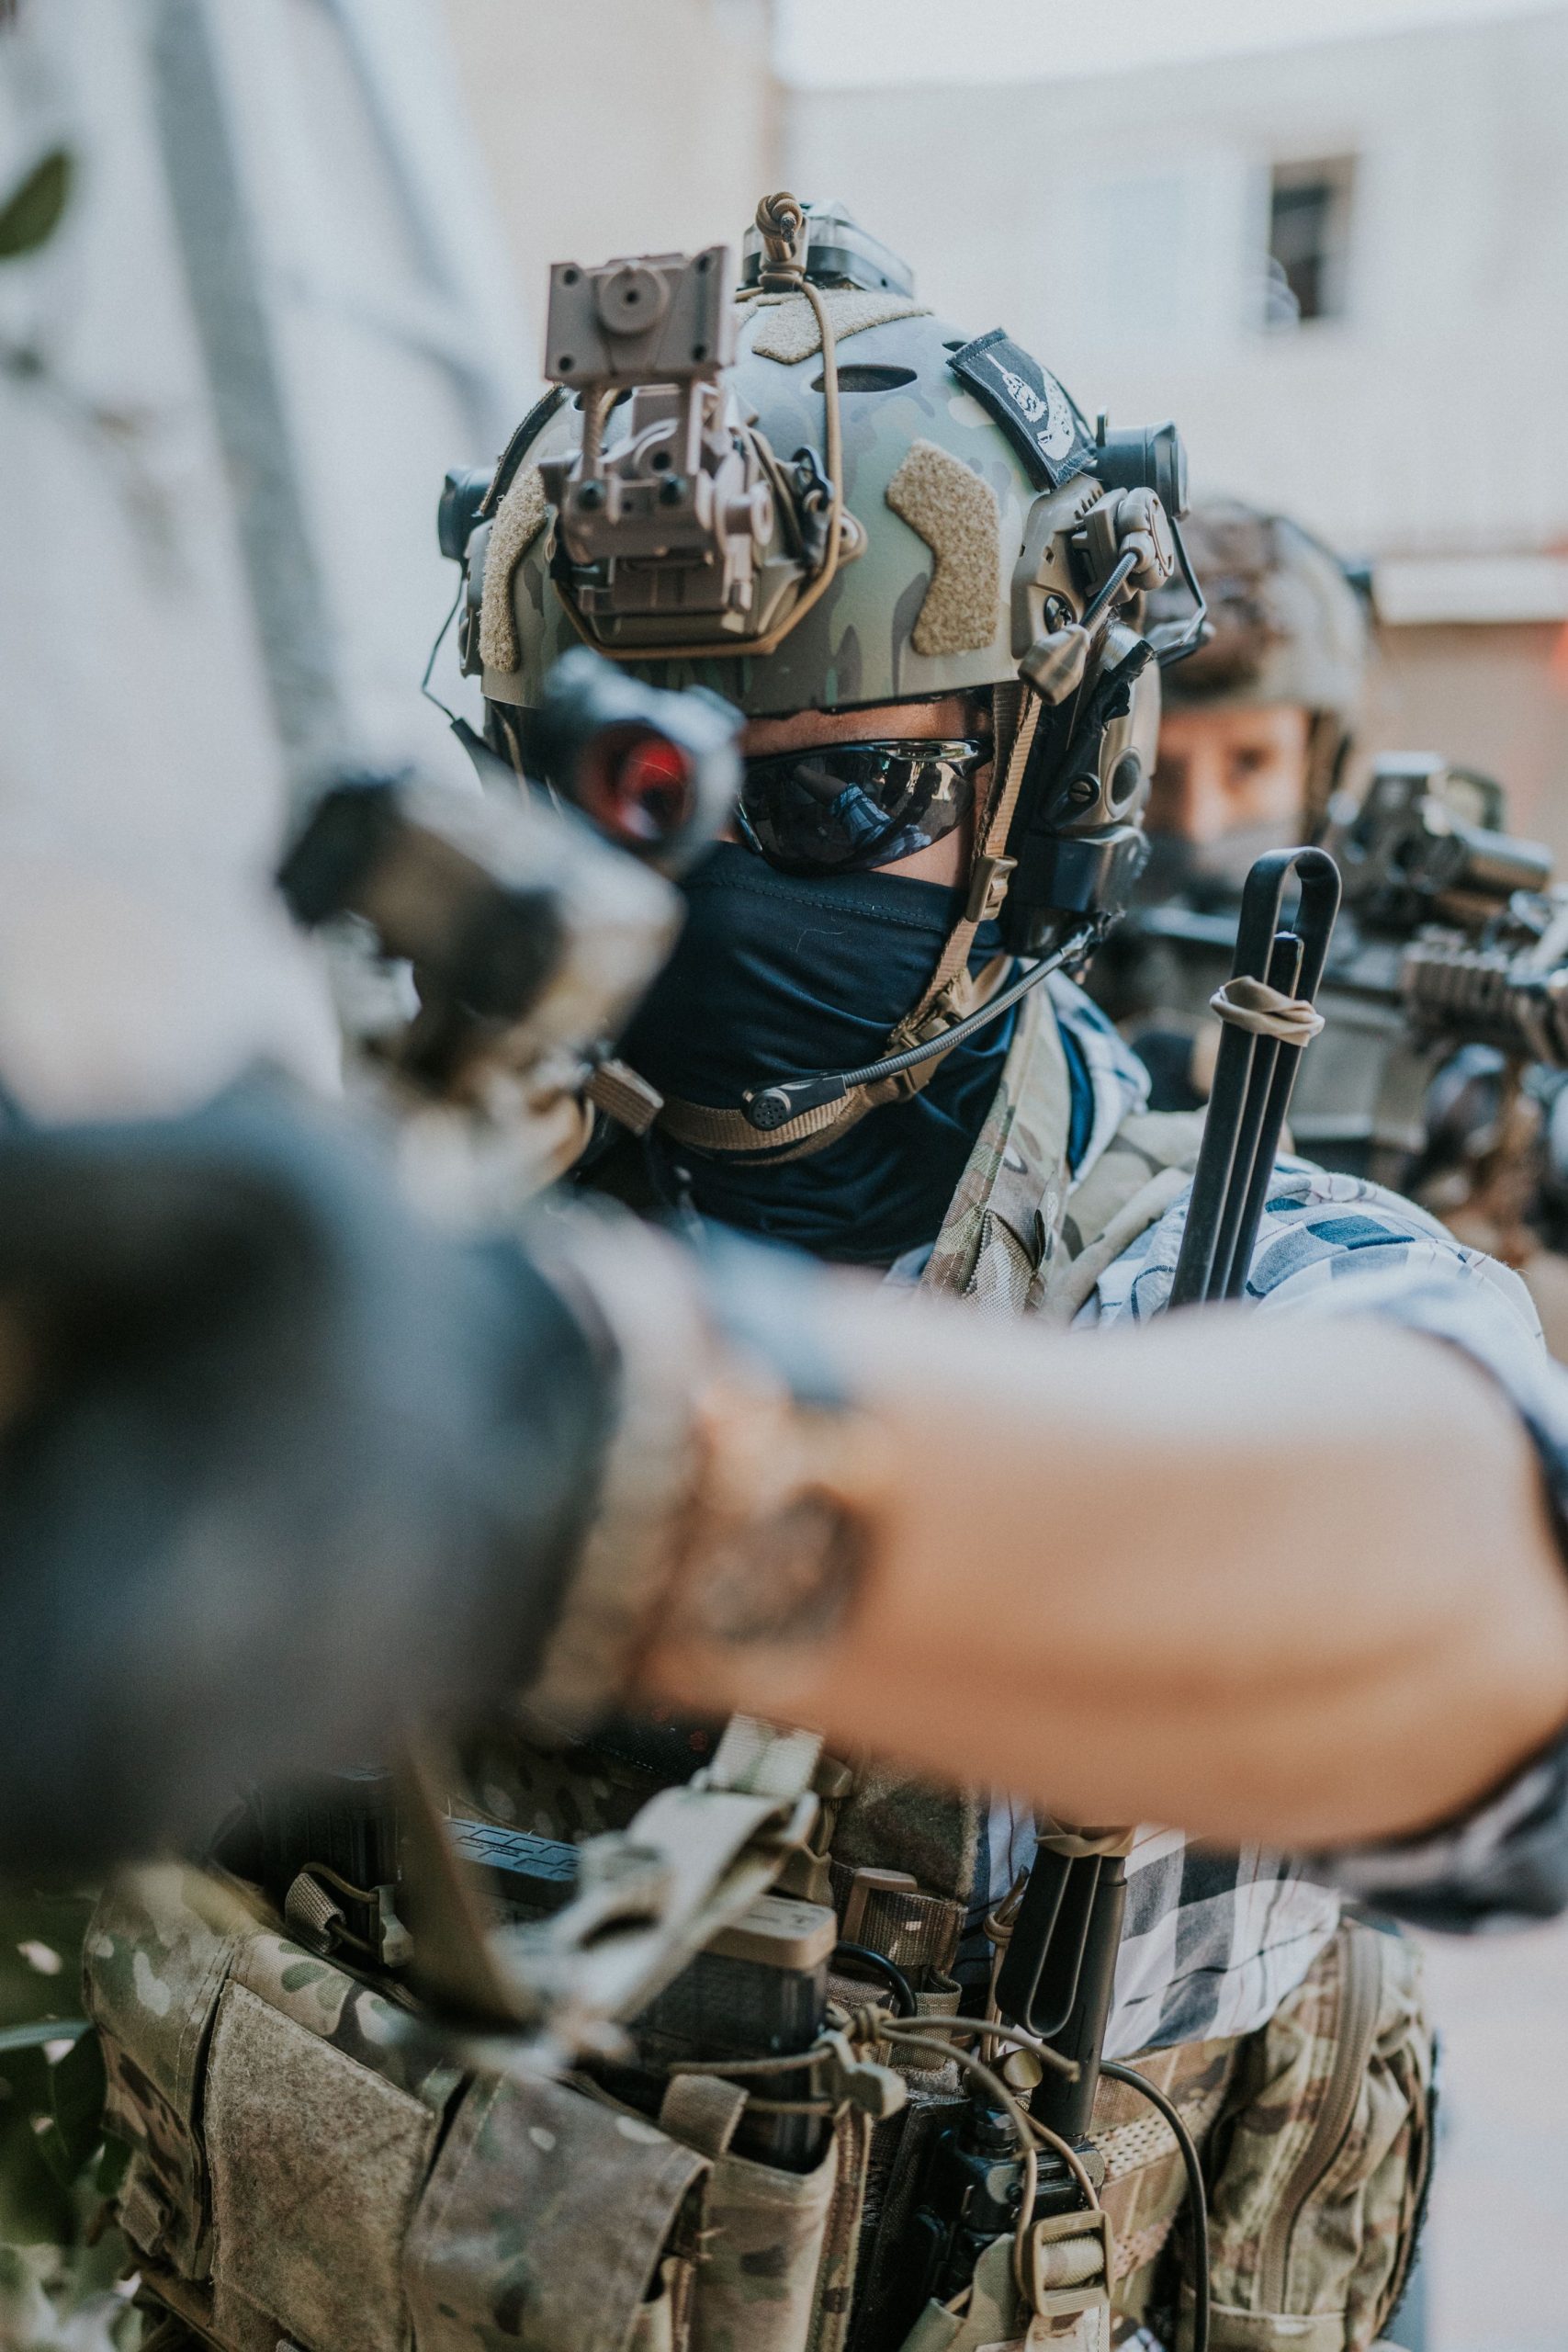
The 2016 memorandum of understanding governing U.S. military assistance to Israel expires in 2028. Negotiations on a successor began in June 2026 and have since stalled.We judge that Israel will not seek unconditional renewal of the current grant-based model.
Colombia: De la Espriella's Military-Led Security Strategy and Its Risks
AUG 12, 2026
AEGIS | AHSAM Regional Analysts
Latin America Security Program

Abelardo de la Espriella was inaugurated as Colombia's president on 7 August 2026 after a campaign built on ending his predecessor's "total peace" negotiation framework and launching a military-led crackdown against the country's armed and criminal groups.We judge that total peace failed to arrest a decade-long expansion of these groups, whose estimated combined membership nearly doubled between 2022 and 2025.
Western Europe's Hottest June–July: Record Heat and Compound Wildfire Risk
Copernicus Climate Change Service data confirm that Western Europe recorded its warmest June–July period in the observational record in 2026, with July ranking as the third-warmest on record for the region and driving widespread wildfire activity across Spain and France.
Western Europe's Hottest June–July: Record Heat and Compound Wildfire Risk
June–July 2026 anomalies reached +2.79°C above the 1991–2020 baseline across the Western European climate region — the warmest such period on record — with July individually ranking as the third-warmest on record. Extreme heat combined with drought conditions to drive widespread wildfire activity, concentrated in Spain and France.
Assessment Summary
Copernicus Climate Change Service (C3S) data, published 10 August 2026, indicate that Western Europe recorded its highest June–July temperatures on record, with a regional anomaly of +2.79°C against the 1991–2020 baseline, and that July 2026 individually was the third-warmest July on record for the region. We assess with high confidence that the anomaly is consistent with, and an extension of, an accelerating warming trend visible in the underlying 46-year dataset since roughly 2015, and with moderate confidence that the extreme heat and associated drought conditions were the primary drivers of the widespread wildfire activity reported across the Iberian Peninsula and France during the same period.
The June–July 2026 anomaly is a record within the analyzed series: at +2.79°C above the 1991–2020 average, the two-month anomaly exceeds every prior year in the Copernicus series reviewed (1980–2026), including the previously elevated readings of the early-to-mid 2020s.
Warming is spatially concentrated in the western and southern part of the continent: the anomaly map shows the most intense warm departures — "much warmer than average" to "warmest" categories — concentrated over the Iberian Peninsula, France, and the British Isles, the area Copernicus defines as the Western European climate region, while parts of Scandinavia and the Baltic states registered near-average or cooler-than-average conditions.
The trend is decadal, not a single-year outlier: the 1980–2026 anomaly series shows predominantly negative departures through the mid-1990s, a mixed transitional period through the 2000s and early 2010s, and consistently positive anomalies from approximately 2015 onward, with 2026 setting the series maximum.
Heat and drought conditions are assessed as the principal drivers of the wildfire activity reported in Spain and France during the same window, consistent with the well-established heat–drought–fire compounding pattern seen in prior extreme European summers; we do not have ignition-source or fire-perimeter data to confirm causation for individual fire events.
Near-term wildfire and heat-health risk remains elevated across the Iberian Peninsula and southern France while the anomaly persists, given continued dry vegetation conditions typically associated with a record-warm June–July period.
Attribution of the specific +2.79°C magnitude to any single atmospheric driver (e.g., a particular blocking pattern or sea-surface temperature configuration) cannot be established from the summary anomaly data alone and would require dedicated meteorological attribution analysis.
Reference Diagram: Regional Anomaly Distribution
Baseline Profile, by Sub-Region
Anomaly Trend, Selected Points in the 1980–2026 Series
SELECTED YEARS, JUNE–JULY TEMPERATURE ANOMALY VS. 1991–2020 AVERAGE
Comparative Trend Snapshot (Open-Source, Illustrative)
Source Diagram Referenced by This Assessment
Western Europe Recorded Its Highest Temperatures on Record in June and July
The source graphic analyzed for this assessment presents two panels: a map of June–July 2026 temperature anomalies across Europe relative to the 1991–2020 average, and a bar chart of Western European June–July anomalies for each year from 1980 to 2026.
The map shows the most intense warm departures concentrated over the Iberian Peninsula, France, and the British Isles — the area Copernicus delineates as the Western European climate region — with near-average to cooler-than-average conditions over parts of Scandinavia and Eastern Europe.
The bar chart shows June–July anomalies moving from predominantly negative values in the early 1980s to consistently positive values from roughly 2015 onward, culminating in a series maximum of +2.79°C in 2026. The accompanying text states that July 2026 was the third-warmest July on record for the region, and that the resulting hot, dry conditions drove widespread wildfires across the continent, particularly in Spain and France.
Published: 10 August 2026
Official & Open-Source Source Panel
Copernicus Climate Change Service (C3S)
climate.copernicus.eu
Primary source for the June–July 2026 anomaly map and the 1980–2026 anomaly bar chart underlying this assessment; confirms the +2.79°C regional anomaly and the third-warmest-July ranking.
World Meteorological Organization (WMO)
wmo.int
Provides broader global-context climate monitoring that situates the Western European anomaly within concurrent international temperature reporting.
AEMET (Spain) & Météo-France
aemet.es · meteofrance.fr
National meteorological services with direct observational responsibility for the two states identified as the epicenter of wildfire activity during the anomaly period.
European Forest Fire Information System (EFFIS)
effis.jrc.ec.europa.eu
Relevant reference point for cross-checking wildfire extent and activity in Spain and France against the heat and drought conditions described in the source material.
CSIS & RANE-Style Open-Source Commentary
Illustrative analytic framing
Comparative think-tank and risk-intelligence commentary on climate-driven security and infrastructure risk informs the framing of the Indicators to Watch below.
Open-Source Wire & Outlet Reporting
Illustrative — general wire coverage
General wire and outlet coverage of the June–July 2026 European heat episode provides supplementary context on wildfire impacts and public response.
Indicators to Watch
Wildfire Escalation, Iberia & Southern France
Continued dry, warm conditions following a record June–July anomaly raise the likelihood of further large-fire activity; fire-perimeter and containment data from EFFIS and national agencies are the key near-term indicator.
Heat-Health and Infrastructure Strain
Sustained record heat carries elevated public-health risk and stresses power, water, and agricultural systems across the affected sub-regions; excess-mortality and grid-demand reporting are relevant indicators to monitor.
Accelerating Decadal Warming Trend
Whether subsequent years continue the consistently positive anomaly pattern observed since roughly 2015, or 2026 proves a singular outlier, will be a key test of the underlying trend identified in this assessment.
Sourcing & methodology. This assessment analyzes a Copernicus Climate Change Service (C3S) infographic published 10 August 2026, comprising a June–July 2026 European temperature-anomaly map and a 1980–2026 Western European anomaly bar chart, as its primary source. It is cross-referenced against general open-source and institutional reporting patterns associated with WMO, national meteorological services, and European wildfire monitoring. The reference diagram in this document is an AHSAM analytic rendering rather than a reproduction of the Copernicus source graphic. Findings are structured as a bottom-line-up-front summary with calibrated key judgments (high / moderate / low confidence) and should be read as a working analytic assessment, not a finalized climatological record.
The Sanctioning Russia and Iran Act of 2026: Codification vs. Enforcement

AUG 11, 2026
Philip Luck
Director, Economics Program and Scholl Chair in International Business
AUG 11, 2026
AEGIS I AHSAM Regional Analysts
Analysis Desk
AUG 11, 2026
Brad Spicher
Research Intern, Economics Program and Scholl Chair in International Business
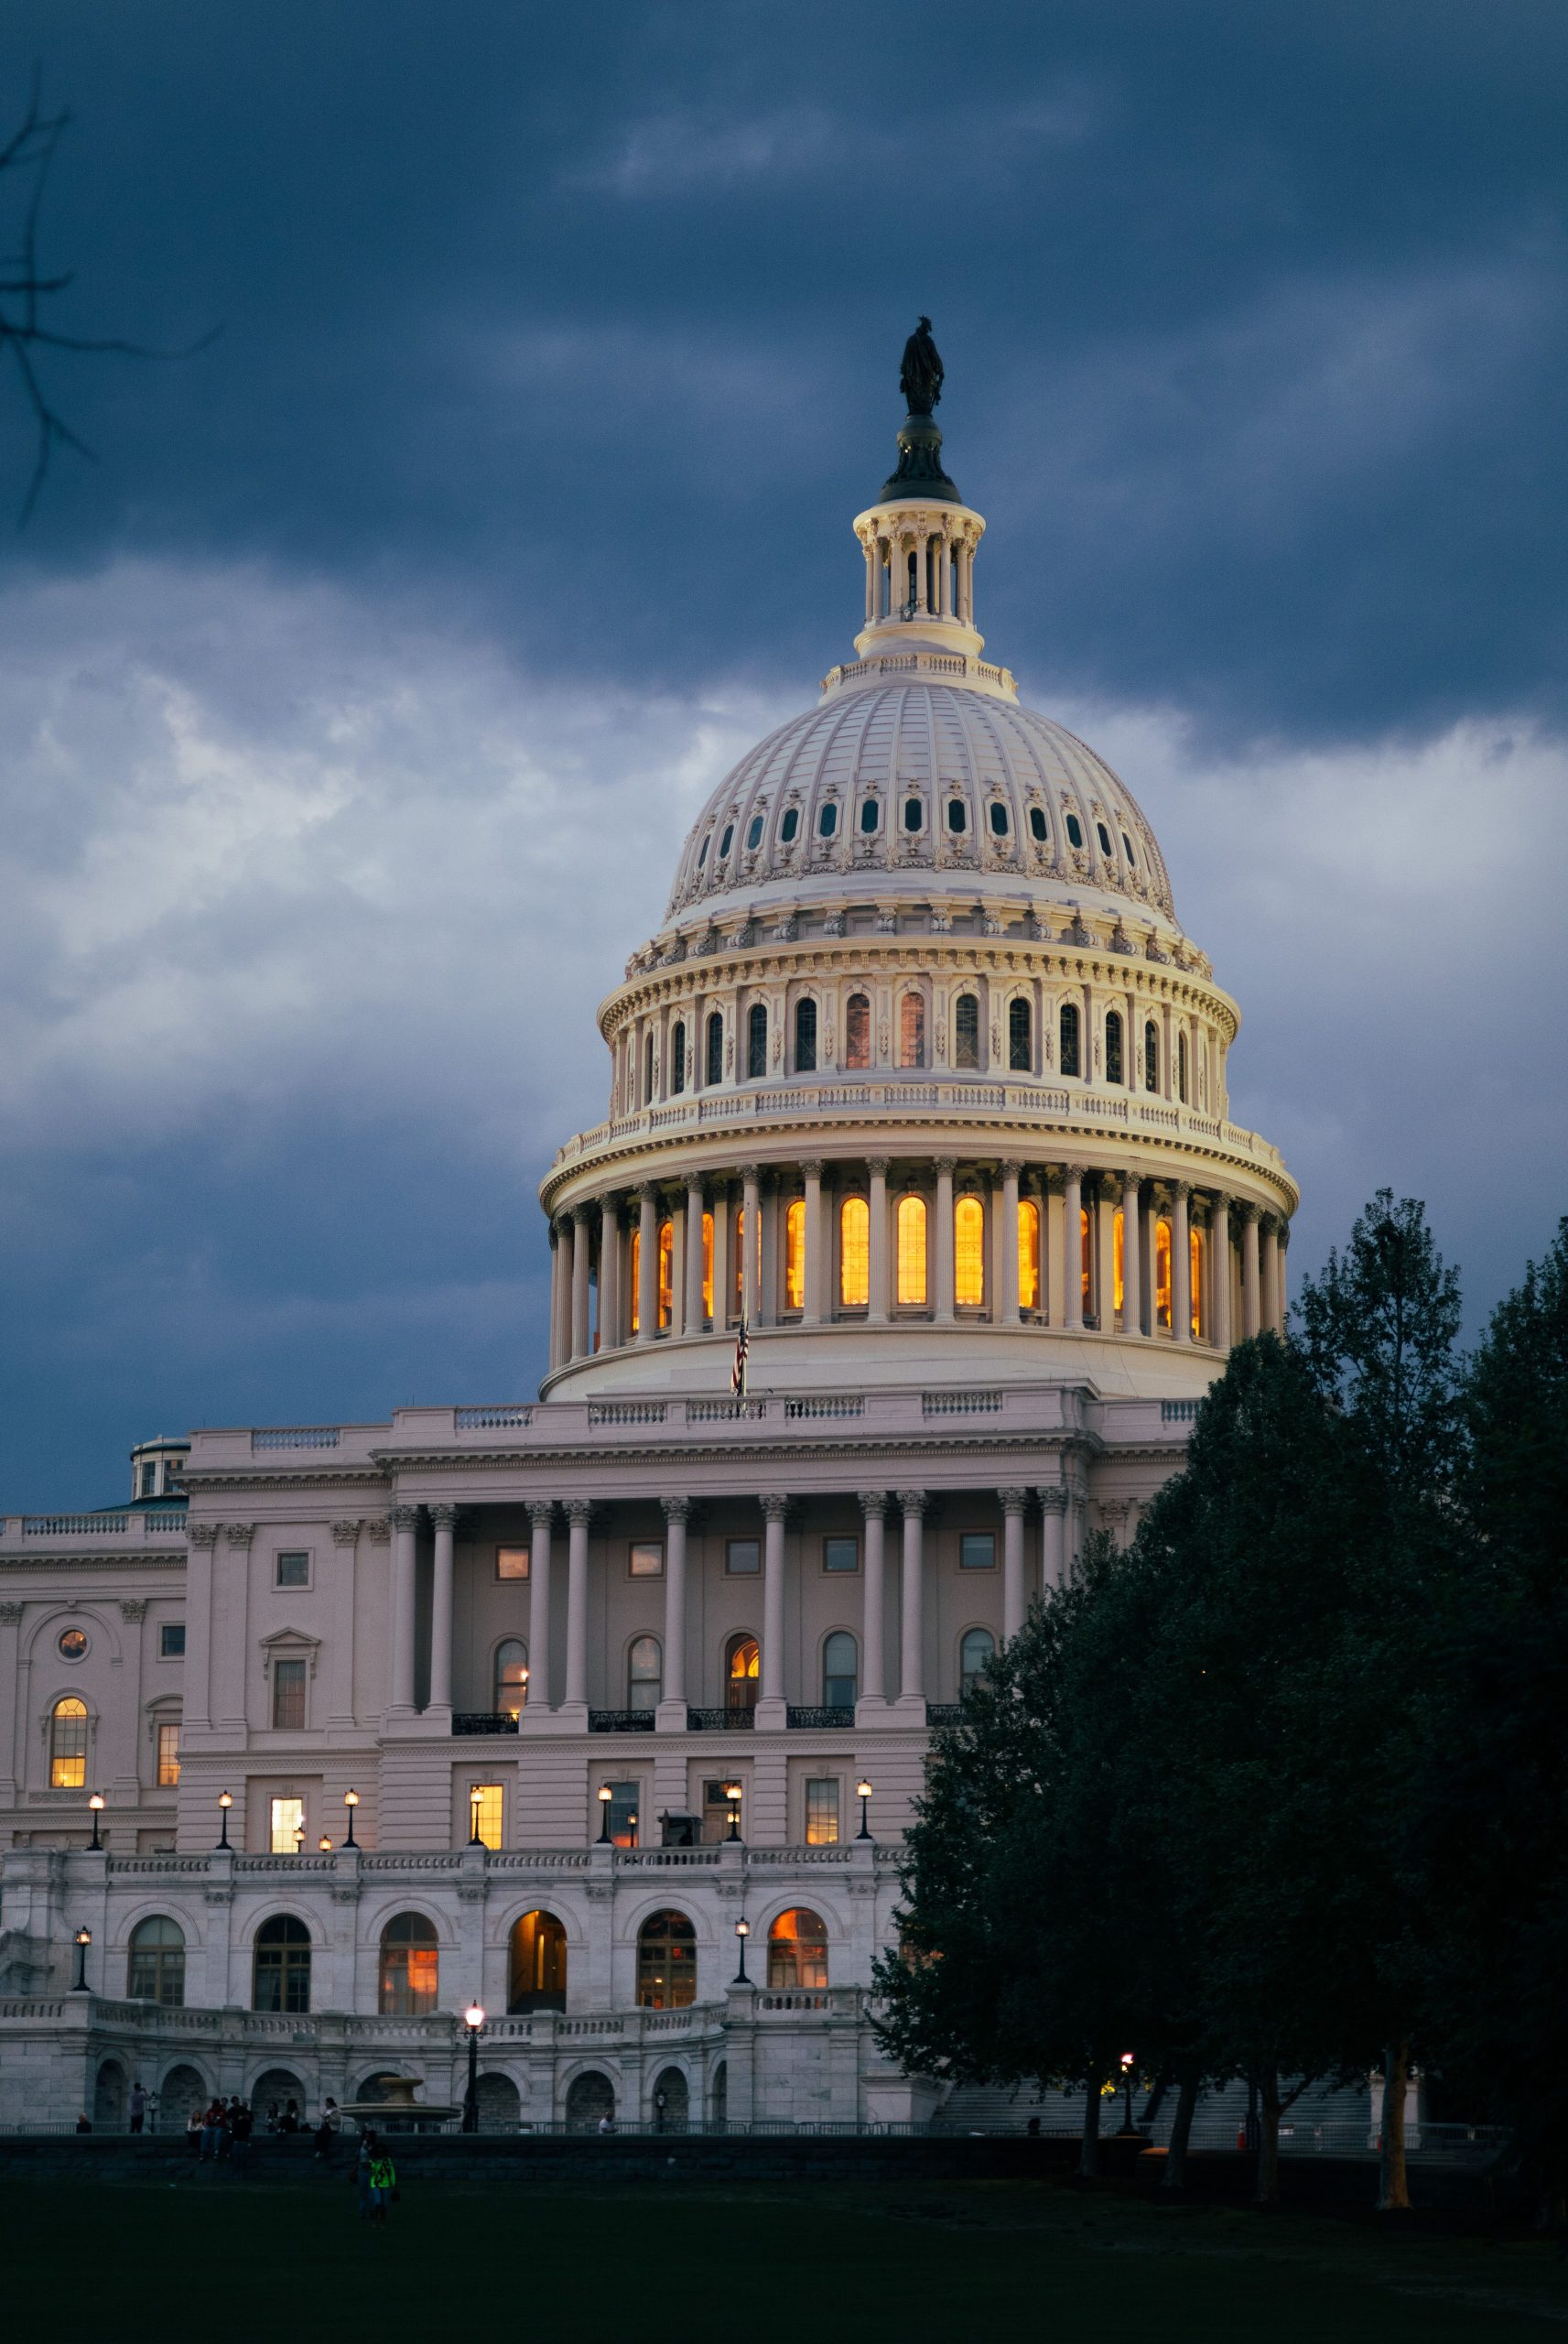
The Sanctioning Russia and Iran Act of 2026 passed the Senate on 7 August 2026 and is expected to reach the House floor within weeks.We assess that passage signals durable congressional support for economic pressure on Moscow, but that it will not, by itself, restore the pace of sanctions activity seen from 2022 through early 2025. The bill delivers on three narrower but consequential points: it signals that congressional resolve has not decayed alongside the designation tempo, it locks in three years of hard-won restrictions against unilateral reversal, and it creates new tariff and shadow-fleet authorities that reshape the market conditions determining what Russia earns per barrel of exported oil.
Makkah Joint Defence Agreement: Trilateral Mutual Defense Pact
On 7 August 2026, Pakistan, Saudi Arabia, and Türkiye signed a mutual-defense treaty in Makkah establishing an all-for-one collective-defense commitment among the three states.
Makkah Joint Defence Agreement: Trilateral Mutual Defense Pact
Signed at Al-Safa Palace by Crown Prince Mohammed bin Salman, President Recep Tayyip Erdoğan, and Prime Minister Shehbaz Sharif, the Makkah Accord commits Saudi Arabia, Türkiye, and Pakistan to treat an armed attack on any one signatory as an attack on all — a NATO-style Article 5 construct signed against the backdrop of active US-Israel-Iran hostilities and Houthi strikes on Yemen.
Assessment Summary
Pakistan, Saudi Arabia, and Türkiye signed the Makkah Joint Defence Agreement on 7 August 2026, establishing a collective-defense arrangement under which an armed attack on any one signatory is to be treated as an attack on all three, framed by all parties as consistent with Article 51 of the UN Charter. We assess with high confidence that the pact formalizes and multilateralizes an existing bilateral security relationship — the September 2025 Pakistan-Saudi Strategic Mutual Defence Agreement — by adding Türkiye and an explicit collective-defense clause, and with moderate confidence that its immediate driver is the active regional conflict environment (US/Israel-Iran hostilities since 28 February 2026 and Houthi strikes on Yemen) rather than a single discrete threat to any one signatory.
The accord builds on, rather than replaces, existing ties: Islamabad has stated explicitly that the Makkah Accord does not abrogate or replace any existing bilateral or multilateral agreements between the three states or with other countries and organizations, indicating an additive rather than a substitutive alliance structure.
Officially framed as defensive and non-exclusionary: Pakistan's Deputy Prime Minister/Foreign Minister has publicly characterized the pact as "defensive in nature," "not directed against any country," and open to additional signatories, a framing echoed in the joint statement's collective-deterrence language.
Symbolic staging reinforces Islamic-solidarity framing: the choice of venue (Makkah), timing (Friday congregational prayer), and Islamic-calendar dating in the official release (24 Safar 1448 AH) situates the pact within a religious-fraternal register alongside its strategic content.
Asymmetric capability mix among signatories: Pakistan supplies the bloc's only nuclear deterrent and a large standing military; Saudi Arabia contributes financial depth, energy leverage, and a well-equipped air force; Türkiye contributes NATO-interoperable forces and an established defense-industrial base — a combination open-source commentary has likened to an informal nuclear-umbrella arrangement, though none of the three governments has characterized it in those terms.
Timing is linked to the active regional conflict environment: the signing occurred amid ongoing US/Israel-Iran hostilities (reported as active since 28 February 2026) and Houthi missile strikes on Yemen, suggesting the accord is at least partly a hedge against spillover risk rather than a response to a single bilateral dispute.
Operational and command-integration details remain undisclosed; open reporting has not established whether the accord includes joint force planning, basing arrangements, or an integrated command structure comparable to NATO's, and we assess with low confidence any near-term move toward such integration absent further disclosure.
Reference Diagram: Signatory Alignment and Collective-Defense Clause
Baseline Profile, by Signatory State
Recent Developments in Official & Open-Source Reporting
SELECTED EVENTS (SEPTEMBER 2025–AUGUST 2026)
Comparative Capability Snapshot (Open-Source, Illustrative)
Official & Open-Source Source Panel
Ministry of Foreign Affairs, Pakistan
mofa.gov.pk — Press Release 207/2026
Source of the DPM/FM's "Message to the Nation," the primary document analyzed in this assessment; confirms the 7 August signing date, venue, and the accord's stated defensive rationale.
Saudi Press Agency (SPA)
spa.gov.sa — Joint Statement, Makkah Al-Mukarramah Summit
Publishes the trilateral joint statement, including the collective-deterrence language and the "attack against one, attack against all" formulation cited across subsequent reporting.
Turkish Presidency / Anadolu
tccb.gov.tr — Presidential Press Office materials
Corroborates President Erdoğan's participation and provides Turkish-side visual and statement materials from the signing ceremony at Al-Safa Palace.
Open-Source Wire & Outlet Reporting
Reuters · AFP · Al Jazeera · The Guardian · Dawn · PBS NewsHour · Breaking Defense
Cross-references signatory statements, provides the September 2025 precursor-agreement context, and situates the accord within the concurrent US/Israel-Iran conflict and Houthi strikes.
Atlantic Council
atlanticcouncil.org — expert dispatch, 7 Aug 2026
Provides early expert commentary on the strategic drivers and regional implications of the trilateral pact from a Western think-tank perspective.
Ministry of External Affairs, India
newsonair.gov.in — official statement, Sep 2025
Records New Delhi's stated intent to study the implications of the Pakistan-Saudi defense relationship for India's national security, relevant background for third-party reception of the trilateral accord.
Indicators to Watch
Invocation Threshold and Precedent
The first real-world test of the "attack on one, attack on all" clause — particularly if triggered by an incident linked to the ongoing US/Israel-Iran conflict or Houthi activity — would set a consequential precedent for how broadly the signatories interpret their collective-defense obligation.
Third-Party Reactions
India's prior statement that it would assess implications for its own security, alongside potential Israeli and Iranian reactions given Pakistan's nuclear status and the accord's regional timing, are indicators of how the pact reshapes threat perceptions beyond the three signatories.
Institutionalization Versus Symbolism
Whether the accord evolves toward integrated command structures, joint exercises, or basing arrangements — or remains primarily a political-symbolic instrument — will determine if it constitutes a durable alliance shift or a lower-cost deterrence signal.
Full Text: Message to the Nation by the DPM/FM
Message to the Nation by the DPM/FM on the Signing of the Makkah Joint Defence Agreement
I extend warm felicitations to the nation on the signing of the "Makkah Joint Defence Agreement" (Makkah Accord) by Pakistan, Saudi Arabia and Türkiye in the blessed city of Makkah Al-Mukarramah, on Friday 7th August 2026. This historic accord reflects the depth of our brotherly bonds, shared values and common commitment to peace, security and stability.
The signing of the Makkah Accord is a significant milestone in Pakistan's longstanding strategic relationships with the Kingdom of Saudi Arabia and the Republic of Türkiye. It embodies our shared resolve to strengthen cooperation in addressing the evolving peace and security challenges facing our region.
I wish to reiterate that the Makkah Accord is defensive in nature. It is not directed against any country. Its purpose is to strengthen collective deterrence against external aggression and reinforce our capacity to defend our sovereignty, territorial integrity and peoples.
The Makkah Accord provides that an armed attack against any one of the three countries shall be regarded as an attack against all, consistent with the inherent right of individual and collective self-defence under Article 51 of the United Nations Charter.
Pakistan remains firmly committed to the peaceful resolution of disputes, respect for sovereignty and international law, and the pursuit of regional peace, stability and prosperity.
The Makkah Accord is not an instrument of confrontation, but an expression of our collective commitment to peace through strength, solidarity and mutual respect.
Under the leadership of Prime Minister Muhammad Shehbaz Sharif, Chief of Defence Forces Field Marshal Syed Asim Munir and the Foreign Office of Pakistan have played pivotal role in bringing this historic Makkah Accord to fruition. The leadership and vision in safeguarding Pakistan's national interests and strengthening our strategic partnerships with Saudi Arabia and Türkiye, is commendable.
10 August 2026
207/2026
Sourcing & methodology. This assessment analyzes the Pakistani Ministry of Foreign Affairs' official "Message to the Nation" (Press Release 207/2026, 10 August 2026) as its primary source document, cross-referenced against the Saudi Press Agency's joint-statement text, Turkish presidential materials, and open-source wire and outlet reporting (Reuters, AFP, Al Jazeera, Dawn, The Guardian, PBS NewsHour, Breaking Defense, Atlantic Council, Wikipedia) dated 7-10 August 2026. The reference diagram is an AHSAM analytic rendering rather than a reproduction of any government or press-agency graphic.
The Battle for Hormuz: Contested Waterway Control and the Reordering of the Global LNG Market

AUG 10, 2026
Leslie Palti-Guzman
Senior Associate (Non-Resident), Energy Security and Climate Change Program
AUG 10, 2026
AEGIS | AHSAM Regional Analysts
Energy & Middle East Security Program

Since the U.S.-Iran memorandum of understanding of 17 June 2026 collapsed in July 2026 following Iranian strikes on commercial shipping, transit through the Strait of Hormuz has entered a sustained period of contested control between Washington and Tehran, with direct consequences for global liquefied natural gas (LNG) markets.
Reading Hakan Fidan: Strategic Assessment of the Mecca Joint Defense Agreement
AUG 9, 2026
Cem Atilla SAYGIN
Chief Executive Officer of AEGIS | AHSAM

On 7 August 2026, Türkiye, Saudi Arabia, and Pakistan signed the Mecca Joint Defense Agreement (MJDA), and Turkish Foreign Minister Hakan Fidan subsequently gave the most detailed public account to date of Ankara's rationale, in remarks to Anadolu Agency's Editor's Desk program.
Drought-Constrained Nuclear Generation: France, August 2026
Hydrological limits on cooling-water availability have forced EDF to take three reactors offline and curtail output at four others across the Meuse, Moselle, and Rhône river basins. This assessment applies structured analytic tradecraft — confidence-graded key judgments, a site-by-site baseline, and a documented official-source trail — to evaluate the state of France's drought-constrained nuclear fleet as of early August 2026.
Drought-Constrained Nuclear Generation: France, August 2026
Record-low flow on the Meuse and Moselle has taken Chooz and Cattenom offline, while thermal limits on the Rhône have cut output at Bugey, Saint-Alban, and Tricastin — a recurring, structural exposure for a fleet that supplies roughly two-thirds of French electricity.
Assessment Summary
EDF has taken three reactors offline (Chooz 1, Chooz 2, Cattenom 1) and reduced output at four others (Bugey 3, Tricastin 4, Saint-Alban 1, Saint-Alban 2) as of early August 2026, citing insufficient Meuse and Moselle river flow under regulatory thresholds set by France's 1998 Franco-Belgian Meuse Agreement and ASNR environmental discharge limits. We assess with high confidence that the measures are precautionary regulatory compliance rather than safety-driven emergency shutdowns, and with moderate confidence that further curtailment is likely if the current drought — France's driest and hottest July since 1900, per Météo-France — persists into late August.
Regulatory, not safety, trigger: the shutdowns stem from environmental discharge and withdrawal limits, not reactor-safety faults; both EDF and the ASNR characterize the measures as routine, controlled compliance actions with no impact on nuclear safety.
Legal basis is explicit at Chooz: curtailment there is tied directly to the 8 September 1998 Franco-Belgian Meuse Agreement governing shared water management on the river, given the plant's location in a Meuse meander near the Belgian border.
Fleet-wide exposure is structural: all 57 French reactors depend on river or coastal water for cooling, and recurring curtailment episodes in 2022, 2024, 2025, and 2026 indicate a persistent, climate-linked vulnerability rather than a one-off event.
Near-term grid impact remains limited: EDF states average annual production loss from heat- and low-flow-related curtailment is about 0.3%, though single episodes — such as June 2026 — have cut fleet-wide output by as much as 8.7%.
Drought conditions are historically extreme: Météo-France's climate bulletin confirms July 2026 as the hottest July nationally since records began in 1900 (24.9°C, +3.8°C above normal), with an approximate 70% precipitation deficit underlying the basin-wide low-flow conditions.
Material national supply-security risk is assessed as low at present, given the scale of unaffected capacity and EDF's demonstrated ability to manage curtailment through precautionary, staggered reductions rather than uncontrolled outages.
Reference Map: Reactor Status by River Basin

Baseline Status, by Reactor Site
Recent Developments in Official & Open-Source Reporting
SELECTED EVENTS (JULY–AUGUST 2026)
Fleet Exposure and Historical Curtailment Losses
Official & Regulatory Source Panel
EDF (Operator)
edf.fr — CNPE Cattenom communiqué
Confirms Cattenom Unit 1 taken offline preventively overnight 31 Jul–1 Aug due to declining Moselle flow, and cites compliance with environmental regulation as the sole driver, with no safety impact.
ASNR (Nuclear Safety & Radiation Protection Authority)
asnr.fr — regulatory framework
Sets and enforces the thermal-discharge and water-withdrawal limits French reactors must respect during low-flow, high-temperature river conditions, and characterizes precautionary shutdowns as routine compliance.
Météo-France (National Weather Service)
meteofrance.fr — climate bulletin, 4 Aug 2026
Confirms July 2026 as the hottest July nationally recorded since 1900 (24.9°C, +3.8°C vs. norm), with an approximate 70% precipitation deficit underlying the basin-wide low-flow conditions.
RTE (Grid Operator)
rte-france.com — 2025 Bilan électrique
Reports 2025 nuclear output at 373.0 TWh, representing 68.1% of total French electricity production — the baseline against which current curtailment exposure is assessed.
Franco-Belgian Meuse Agreement
8 September 1998 — bilateral water treaty
Governs shared management of Meuse river waters between France and Belgium; cited explicitly by EDF as the legal basis for the Chooz Unit 1 shutdown given the plant's location near the Belgian border.
Open-Source Wire Reporting
AFP · franceinfo · Reuters · Euronews
Corroborates EDF's site-level disclosures and provides cross-referenced timing for individual reactor status changes between late July and early August 2026.
Indicators to Watch
Further Rhône-System Curtailment
Continued low flow or elevated temperature on the Rhône could extend reduced-output status at Bugey, Saint-Alban, or Tricastin from partial-day adjustments to sustained curtailment if the drought persists into late August.
Cross-Border Sensitivity at Cattenom
Cattenom is a recurring point of friction with Luxembourg, whose authorities have long advocated its closure; sustained drought-driven curtailment there carries diplomatic as well as operational dimensions.
A Recurring, Not Anomalous, Pattern
Comparable curtailment episodes occurred in 2022, 2024, and June 2025 and June 2026 — indicating a structural, climate-linked constraint on French nuclear generation rather than a single anomalous summer.
Sourcing & methodology. Reactor-site status, dates, and figures are drawn from EDF operational communiqués and transparency notices, cross-referenced against ASNR regulatory guidance, Météo-France's climate bulletin of 4 August 2026, RTE's 2025 annual electricity report, and open-source wire reporting (AFP, franceinfo, Reuters, Euronews) dated late July through early August 2026. The reference map is an AHSAM analytic rendering built from this reporting rather than a reproduction of any single third-party graphic.
Confidence levels follow standard analytic tradecraft convention (High / Moderate / Low), reflecting the quality, corroboration, and consistency of underlying sourcing rather than the significance of the judgment itself. Some figures — including exact restart timing and the precise duration of individual output reductions — remain fluid as EDF updates its transparency notices, and are presented here as a working, open-source assessment rather than a finalized record.
The Mecca Joint Defense Agreement: A New Collective-Defense Architecture in the Muslim World
AUG 8, 2026
AEGIS I AHSAM Regional Analysts
Middle East & South Asia Security Program
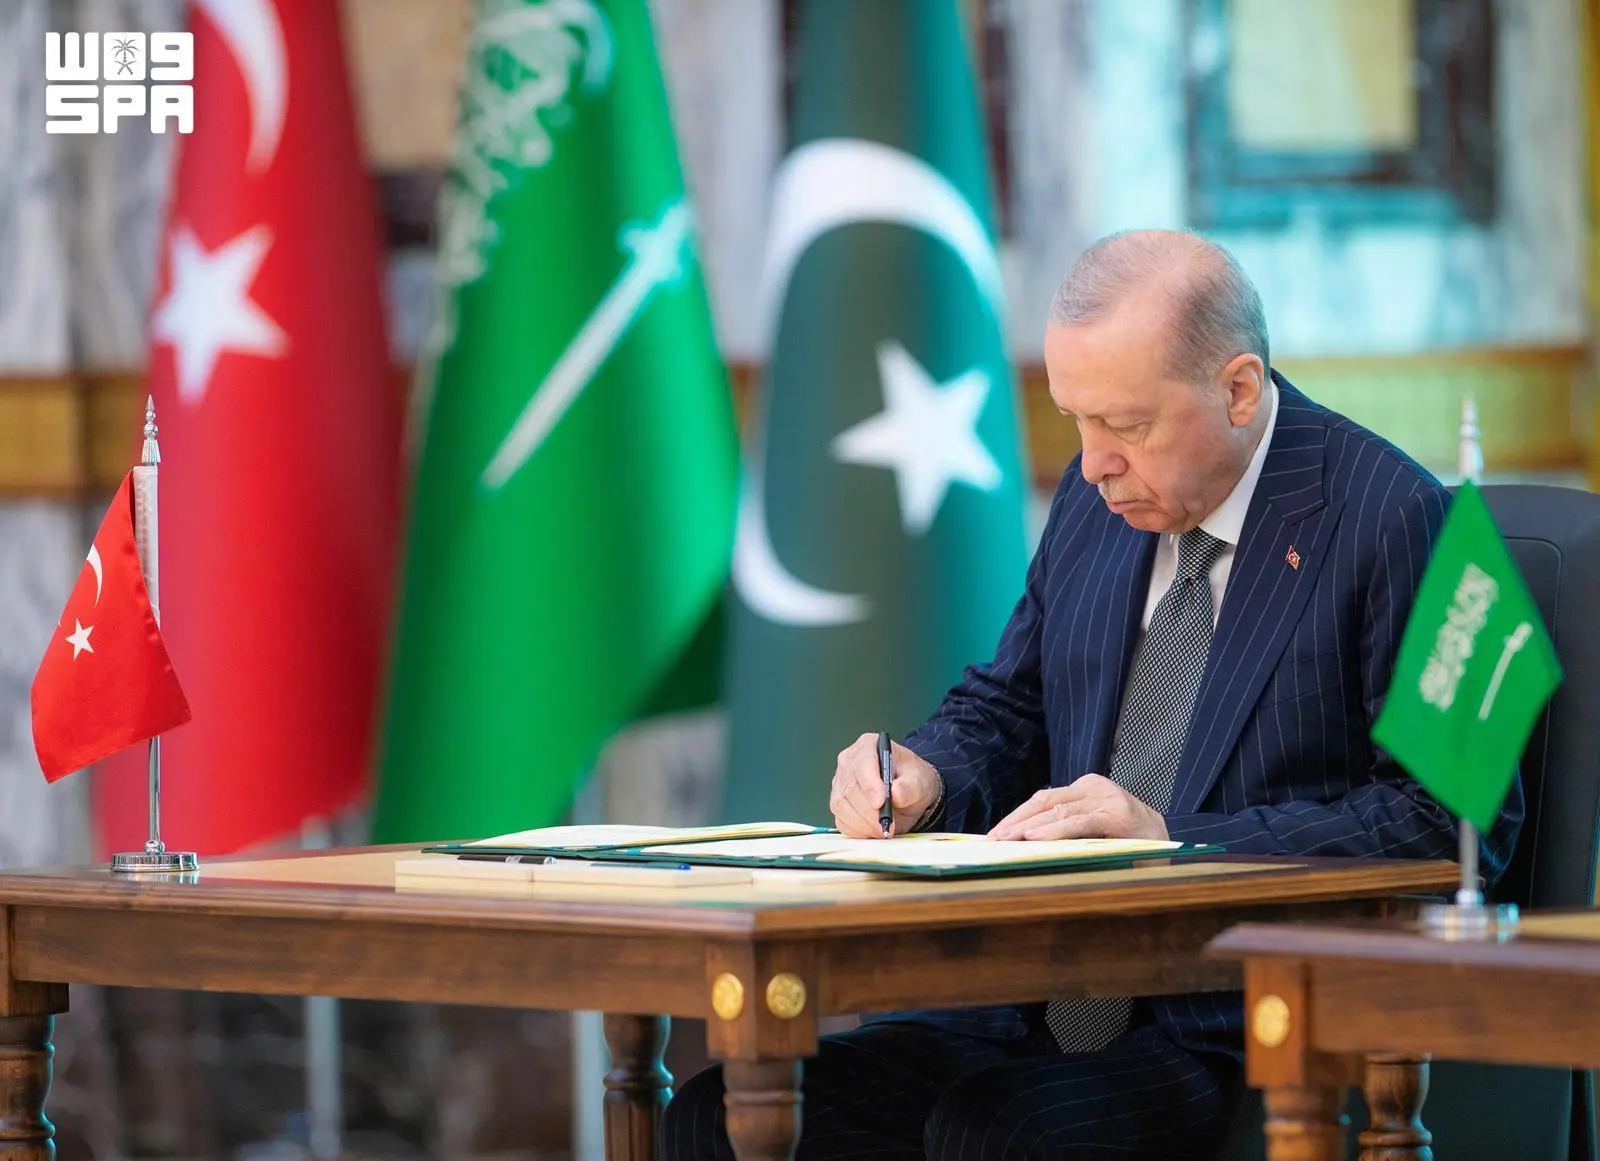
On 7 August 2026, Türkiye, Saudi Arabia, and Pakistan signed the Mecca Joint Defense Agreement at Al-Safa Palace in Mecca, formalizing a trilateral collective-defense commitment among three of the Muslim world's most militarily and economically significant states.
How Tehran's Use of Cyber Operations in the U.S.-Iran Conflict Has Evolved
AUG 7, 2026
Nikita Shah
Senior Fellow, Intelligence, National Security, and Technology Program

In the week following 26 July 2026, concurrent intrusions struck water-sector facilities across at least six U.S. states, prompting the U.S. Cybersecurity and Infrastructure Security Agency to upgrade an advisory issued only days earlier and urge operators to disconnect exposed operational technology from the internet. Formal attribution remains unconfirmed, but the operational signature points toward Iranian state or state-aligned actors.
Europe's 2026 Heat Emergency: Cascading Climate, Energy, and Public-Health Risk
A sustained heat and drought episode across Western, Central, and Southeastern Europe has produced near-record temperatures, historic river-level lows, and an estimated death toll approaching 20,000 for the year to date. This assessment applies structured analytic tradecraft — confidence-graded key judgments, a country-by-country baseline, and a documented sourcing trail — to evaluate the state of the crisis as of early August 2026.
Europe's 2026 Heat Emergency: Cascading Climate, Energy, and Public-Health Risk
Nationwide red alerts, collapsing river levels on the Rhine and Danube, and reactor-cooling constraints in France and Hungary indicate that this summer's heat and drought episode has moved from a public-health story into a cross-sectoral resilience test for the continent's energy and water systems.
Assessment Summary
Europe is experiencing a multi-month, multi-country heat and drought episode that has produced nationwide red alerts in at least four states, historic low water levels on the Rhine and Danube, and wildfire losses concentrated in Southwestern Europe. We assess with high confidence that the crisis has moved beyond a public-health event into a cross-sectoral stress test of energy generation, water management, and emergency-care capacity, and with moderate confidence that current forecasts point to limited near-term relief — meaning the risk to energy supply and hospital systems is likely to persist through late summer rather than peak and recede.
At least nine states — the United Kingdom, Germany, Belgium, Spain, France, Italy, Croatia, Austria, and Romania — have declared drought conditions, red heat alerts, or both, with cumulative 2026 heat-related deaths approaching 20,000 across the continent.
River systems central to both freight and power generation are under acute strain: the Rhine has fallen to its lowest recorded level, while record-low Danube levels have exposed sunken WWII-era wreckage in Serbia and nearly forced an emergency shutdown of Hungary's Paks nuclear plant.
Nuclear generation is directly exposed to the drought: France has suspended operations at three reactors amid concerns over Rhône and Garonne cooling-water temperatures and volumes, indicating that thermal-power availability is now a live constraint on top of demand-side pressure from air-conditioning load.
Healthcare systems are showing localized strain rather than uniform collapse: the UK's East Surrey Hospital declared a critical incident restricting services to life-threatening emergencies, while Italy has reported elevated emergency-room admissions and heat-linked power outages tied to surging cooling demand.
Attribution science indicates the pattern is structurally, not incidentally, linked to climate change: the WHO has characterized Europe as the fastest-warming continent, and researchers estimate comparable heatwaves are now roughly thirty times more likely than in the pre-industrial climate.
Forecast guidance as of early August points to limited near-term precipitation relief for the worst-affected areas, though the precision of multi-week rainfall forecasting over Western and Central Europe leaves meaningful uncertainty in the timing of any turnaround.
Reference Map: Country-Level Impacts as Reported
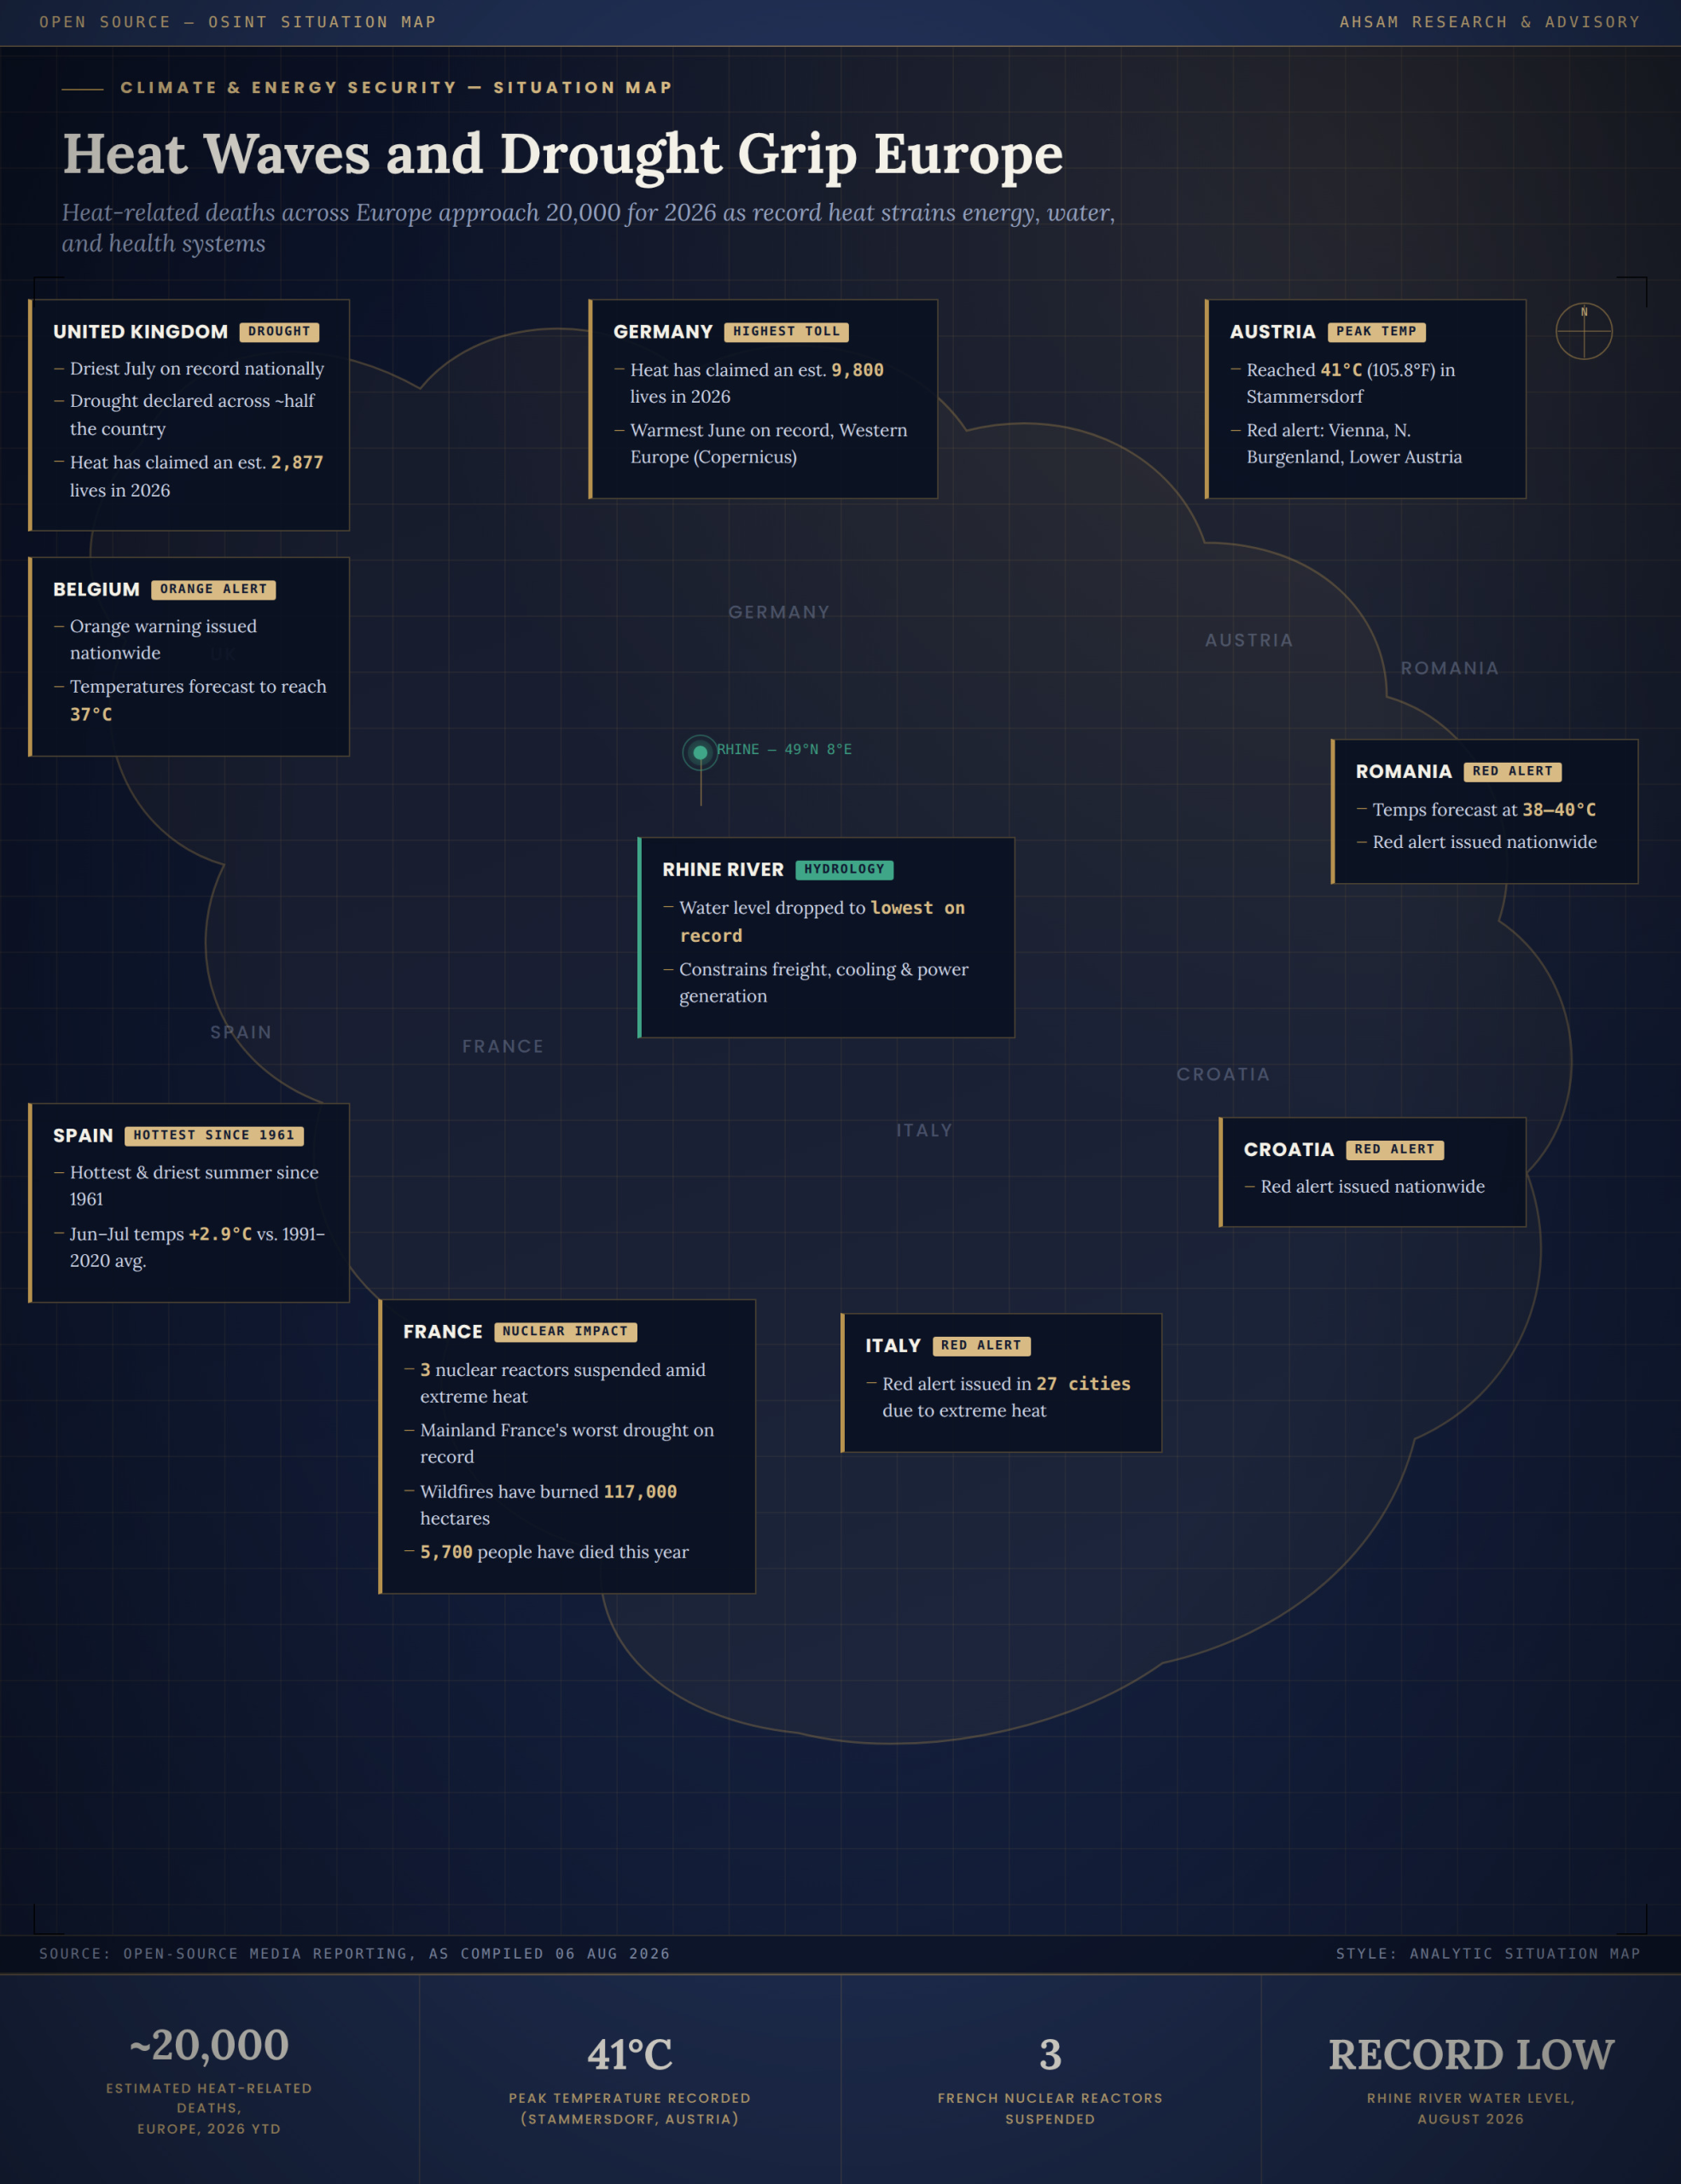
Baseline Impacts and Reported Status, by Country
Recent Developments in Open-Source Reporting
SELECTED EVENTS (LATE JUNE–EARLY AUGUST 2026)
Reported Death Tolls and Peak Temperatures, Selected Countries
Indicators to Watch
Nuclear & Thermal Generation Availability
Further declines in Rhine, Rhône, Garonne, and Danube levels could force additional reactor suspensions in France or an actual (not near-miss) shutdown at Hungary's Paks plant, compounding electricity supply risk during peak cooling demand.
Hospital System Capacity
The East Surrey Hospital critical incident and rising emergency-call volumes elsewhere suggest localized healthcare strain could spread to additional facilities if the heat persists into late August without a cooling break.
A Recurring, Not Anomalous, Pattern
2026 follows comparably severe heatwave seasons in 2024 and 2025, each with tens of thousands of estimated excess deaths — indicating a structural, climate-linked shift in baseline summer risk for Europe rather than a single anomalous year.
Sourcing & methodology. Country-level temperature, alert, and death-toll figures are drawn from the reference infographic supplied for this assessment (dated 6 August 2026) and are presented here as reported, without independent verification of the underlying national data sources. Contextual and chronological detail — including the WHO's excess-death statement, EFFIS wildfire-area figures, Danube and Rhine water-level reporting, the Paks nuclear plant near-shutdown, the East Surrey Hospital critical incident, and the exposed WWII-era wreck near the Serbia–Romania border — draws on Al Jazeera, World Weather Attribution, NPR, the Associated Press (via WTOP News), Reuters, and Scientific American reporting dated late June through early August 2026.
Confidence levels follow standard analytic tradecraft convention (High / Moderate / Low–Moderate), reflecting the quality, corroboration, and consistency of underlying sourcing rather than the significance of the judgment itself. Some figures across sources are not fully reconciled — for example, wildfire hectarage attributed to France varies between the reference infographic and EFFIS-based reporting — and are presented transparently rather than resolved in this working, open-source assessment.
The Local Anchor of Global Corruption: Municipal Governance Failure, 1980–2026
AUG 6, 2026
Cem Atilla SAYGIN
Chief Executive Officer of AEGIS | AHSAM

Comparable cases can be found across virtually every region of the world. A recurring pattern in such investigations is the effort to shift public attention away from corruption allegations by framing judicial proceedings as politically motivated operations, thereby consolidating political support and reinforcing partisan cohesion.
Türkiye’s National Solidarity Bill: Inside the Legal Framework for PKK Disarmament
AUG 5, 2026
Strategic Assessments Desk
AEGIS I AHSAM Regional Analysts
On 5 August 2026, the Presidency of the Republic of Türkiye and the AK Party Group Chairmanship announced the submission of the “Law on Strengthening National Solidarity and Social Integration” to the Grand National Assembly — a 12-article framework governing the deferral of investigations, prosecutions, and sentence enforcement for lower-tier PKK/KCK members, contingent on National Security Council–verified disarmament. Backed by roughly 360 lawmaker signatures and grounded in the 18 February 2026 report of the National Solidarity, Brotherhood and Democracy Commission, the bill moves to the TBMM Justice Commission on 7 August. AHSAM’s infographic compiles the official record — key provisions, sentence-deferral architecture, oversight structure, and President Erdoğan’s full statement on the bill’s submission — as presented by the Presidency, the AK Party Group Chairmanship, and the TBMM Justice Commission Chairmanship.
Riyadh’s Gambit: Saudi Ascendancy Amid Regional War

AUG 5, 2026
AHSAM Regional Analysts
Strategic Assessments Desk

As the U.S.-Israel-Iran confrontation spreads across Iraq, Yemen, the Caspian, and the Suez corridor, Saudi Arabia has emerged as a stabilizing rather than destabilizing actor, transitioning from prolonged strategic patience to calibrated, evidence-based deterrence. Where Iran's proxy network has driven a decentralized, cumulative escalation across multiple theatres, Riyadh's measured, coalition-oriented responses in Iraq and Yemen have functioned as a moderating factor — and are positioning the Kingdom as the organizing anchor of an emerging Gulf-wide security architecture.
The Strait of Hormuz: Governance Architecture and the Path to a New Regime
Following the outbreak of the 2026 Iran war on 28 February and Iran's de facto closure of the Strait, Tehran and Muscat have moved through successive rounds of technical negotiation toward a new transit arrangement. This assessment applies structured analytic tradecraft — confidence-graded key judgments, an indicators framework, and a documented sourcing trail — to evaluate the state of play as of early August 2026.
The Strait of Hormuz: Governance Architecture and the Path to a New Regime
A Malacca-style, sovereignty-preserving transit arrangement between Iran and Oman is now the most likely near-term outcome — but its durability will depend on unresolved questions of control, fees, and linkage to the broader U.S.–Iran de-escalation track.
Assessment Summary
Iran and Oman are in the final stages of negotiating a temporary bilateral transit route through the Strait of Hormuz, replacing the pre-war Traffic Separation Scheme with an arrangement that preserves each state's territorial sovereignty. We assess with high confidence that this represents a durable shift away from a purely internationally-governed transit regime toward direct Iranian-Omani co-management, and with moderate confidence that any final agreement remains contingent on the parallel unwinding of the U.S. naval blockade of Iranian ports — meaning the maritime and diplomatic tracks cannot be assessed independently of one another.
Pre-crisis transit relied on a Traffic Separation Scheme of two two-mile-wide shipping lanes divided by a two-mile buffer zone, governed under international maritime navigation rules rather than a joint Iranian-Omani authority — the baseline against which any new arrangement must be measured.
Oman's proposal is explicitly modeled on the Strait of Malacca precedent, under which Indonesia, Malaysia, and Singapore cooperate on navigational safety while each retains full sovereignty over its territorial waters — an architecture designed to add coordination without creating a supranational authority.
Iran has formally rejected Oman's 50/50 division and submitted a counterproposal seeking to manage the shipping route on its own side while also retaining a monitoring role over portions of the opposite lane — an asymmetric arrangement intended to preserve Iranian oversight of both inbound and outbound traffic.
As of early August 2026, Iranian officials describe negotiations as approaching a route that is "neither the northern nor the southern" corridor — a newly defined, temporary passage in which vessels would enter via an Iranian-controlled segment and exit via an Omani-controlled segment, with service fees levied for security and environmental safeguards.
Tehran has stated unambiguously that the Strait "will never return to its pre-war status," signaling that even a successful Iran-Oman agreement will constitute a structural, not temporary, change in how the waterway is governed going forward.
Regional officials indicate that any final agreement is likely to be linked to the lifting of the U.S. naval blockade on Iranian ports, meaning the technical maritime-governance track and the broader U.S.-Iran de-escalation track are functionally coupled rather than separable negotiating streams.
Iran's Foreign Ministry has stated there are no direct negotiations with Washington even as President Trump has referenced forthcoming U.S.-Iran talks and held off announced strikes — a divergence in public messaging that introduces uncertainty into the timeline and sequencing of any comprehensive settlement.
Governance Baseline, Competing Proposals, and Stakes
The 2026 Hormuz Crisis: Key Developments
EVENT TIMELINE (FEBRUARY–AUGUST 2026)
Scale of Disruption and Market Response
Indicators to Watch
A Signed Interim Route Agreement
Formal announcement of a temporary Iran-Oman transit corridor, including fee structure and lane control — the most probable next concrete milestone given the "final stage" characterization from both sides.
Blockade-Linkage Stalemate
If Washington declines to lift the naval blockade on Iranian ports in step with a Hormuz deal, the agreement could stall even after technical terms are settled — the clearest single point of failure in the current trajectory.
A Permanent Departure from the Pre-War Regime
Tehran's explicit statement that Hormuz "will never return to its pre-war status" suggests that even a successful deal formalizes a new baseline — with implications for future U.S. and allied freedom-of-navigation posture in the Gulf.
Sourcing & methodology. Baseline transit governance, Oman's Malacca-model proposal, and Iran's counterproposal are drawn from official Iranian and Omani statements as reported by regional and international outlets, including Al Jazeera's coverage of the two countries' exchanged proposals (29 July 2026). Chronology and casualty figures draw on open-source reporting on the 2026 Strait of Hormuz crisis. Developments as of 2–4 August 2026 — including the "final stage" characterization of talks, the Iranian Foreign Ministry's statement on the absence of direct U.S. negotiations, and the emerging Iranian-controlled/Omani-controlled route structure — are drawn from Al Jazeera, the Associated Press (via WTOP News), and wire reporting dated 2–4 August 2026.
Confidence levels follow standard analytic tradecraft convention (High / Moderate / Low–Moderate), reflecting the quality, corroboration, and consistency of underlying sourcing rather than the significance of the judgment itself. This is a working, open-source assessment; the final shape, timing, and durability of any Hormuz transit agreement remain subject to change as negotiations continue.
Türkiye's Emerging Centrality in Gulf Security: The Case for a Turkish-Anchored R4
AUG 4, 2026
Cem Atilla SAYGIN
Chief Executive Officer of AEGIS | AHSAM

Of the four states composing the "R4" (Saudi Arabia, Pakistan, Egypt, Türkiye), Türkiye is the member best positioned to convert this nascent framework into a durable, regionally owned security architecture. Ankara alone combines (1) NATO-standard military capability independent of Gulf patronage, (2) working diplomatic channels to all relevant parties — Washington, Tehran, Moscow, Kyiv, and the Gulf capitals simultaneously — and (3) a demonstrated, repeatable track record as a mediator of last resort. Where Saudi Arabia brings capital and Pakistan brings manpower, Türkiye brings architecture: the doctrinal vision, the defense-industrial base, and the diplomatic bandwidth to make the R4 something more than a crisis-management caucus. This assessment argues that Türkiye's centrality is not incidental but structural, and that R4 partners and outside observers alike should recognize Ankara as the framework's most credible long-term anchor..
Russian Blood and Treasure: The Ballooning Costs of Putin's War

AUG 4, 2026
Seth G. Jones
President, Defense and Security Department; Harold Brown Chair

Riley McCabe
Associate Fellow, Warfare, Irregular Threats, and Terrorism Program

Four and a half years into its full-scale invasion of Ukraine, Russia has lost the military initiative even as the human and territorial costs keep climbing, according to new battlefield data compiled by CSIS. Between February 2022 and June 2026, Russian forces have suffered on the order of 1.4 million battlefield casualties, including as many as 450,000 dead — figures that dwarf any losses a major power has absorbed in a single conflict since 1945. Despite that toll, Russian-held territory in Ukraine actually contracted during April and May 2026, the first sustained monthly retreat since August 2024. Meanwhile Ukraine has widened a campaign of short-, medium-, and long-range strikes against Russian military and economic targets, leaning increasingly on AI-guided drones to do so.
Turkish Defense & Aerospace Exports Climb to $1.12 Billion in July
The Presidency of Defense Industries (SSB) reports the sector's export streak extended through July 2026, up 14.4% year-on-year, as year-to-date exports rose 26.2% and the trailing 12-month total pushed past $11 billion for the first time.
Turkish Defense & Aerospace Exports Climb to $1.12 Billion in July
Platform-level export wins in fighter jets, trainers, and naval vessels are converting into a widening, multi-year export base, as monthly and cumulative figures both post double-digit annual growth.
Key Judgments
Growth is broad-based rather than a single-deal spike: July's 14.4% year-on-year gain follows a 26.2% rise across the first seven months of 2026, and the trailing 12-month total crossed $11 billion for the first time in June before extending to $11.2 billion.
The export base is widening geographically within Turkey: the number of provinces exceeding $1 million in sector exports rose from 21 to 26, and the count of defense and aerospace firms among Turkey's top 100 exporters rose from 17 to 26.
Platform-level export wins are driving the medium-term pipeline: the KAAN fifth-generation fighter's initial international sale, HÜRJET's agreement with Spain, and a naval vessel export to Portugal each convert into deliveries over multi-year horizons rather than one-off revenue.
2025's new contract signings show Asia-Pacific and Europe as the leading demand centers ($5.5B and $5.3B respectively), with the Americas, Middle East, and Africa each contributing over $1.5B — indicating diversified rather than regionally concentrated demand.
2026 program milestones for KIZILELMA, KAAN, and the indigenous engine program — alongside NATO-level discussions on technology-transfer restrictions — suggest export momentum could face either acceleration or friction depending on how those dependencies resolve.
Three Programs, Three Export Milestones
Five Years of Monthly Exports — 2026 Breaks From the Pattern
MONTHLY DEFENSE & AEROSPACE EXPORTS ($ BILLION, ILLUSTRATIVE)
Where Growth Is Coming From
Source & methodology. Headline export figures (July 2026 monthly total, January–July cumulative, trailing 12-month total, and year-on-year growth rates) are drawn from statements by SSB President Prof. Dr. Haluk Görgün, published August 3, 2026. Prior-year comparison figures are derived from the stated growth rates. Provincial and top-100-exporter figures, regional new-contract totals, and platform export developments are drawn from SSB public statements and Turkish defense-industry press coverage between February and August 2026.
The monthly trend chart is a stylized visual recreation of a publicly shared SSB chart covering 2022–2026; it is intended to convey trajectory and relative scale, not to serve as a precise data source.
Targeted Facilities of Russia's Largest E-Commerce Platform, Wildberries
Between July 18 and August 3, Ukrainian drone strikes hit Wildberries logistics and warehouse facilities across at least fourteen locations in Russia and Russian-annexed Crimea, according to statements from Russian authorities.

Ukraine Targets Wildberries Logistics Centers
A wave of drone strikes has repeatedly hit distribution hubs of Russia's largest online retailer, from the outskirts of St. Petersburg to Crimea and the North Caucasus.
What the Map Shows
Reported strikes span an unusually wide arc, from Vsevolozhsk near St. Petersburg in the northwest to Sarapul in the east and Simferopol in annexed Crimea in the south.
All named sites are described as facilities belonging to Wildberries, Russia's largest e-commerce platform, rather than conventional military infrastructure.
Photographs accompanying the reports show large plumes of black smoke over warehouse-style structures in Moscow region, St. Petersburg, and Volgograd, consistent with fires at large storage facilities.
The information underlying the map comes from statements by Russian authorities; independent confirmation of strike causes and damage at each site is not established here.
Why Wildberries Is a Target
Wildberries is Russia's largest online retailer, often compared to Amazon, holding roughly 45% of the domestic e-commerce market — making its warehouses uniquely large, centralized, and economically consequential targets.
Ukrainian officials, including President Zelensky, have said the strikes target logistics centers they allege help supply the Russian military with drone components, navigation equipment, and other hardware — not the retail business itself.
Ukraine's drone forces commander has described the campaign partly as a way to disrupt the sense of normal life for Russian civilians far from the front line, alongside the material disruption to logistics.
Independent reporting has documented worker deaths and injuries in the strikes, alongside financial losses for the small and mid-size Russian merchants whose goods are stored in the warehouses.
Where the Strikes Occurred
Facilities Reportedly Struck, by Region
Sites by Region
Source & methodology. Locations and dates reflect public statements by Russian authorities regarding strikes on Wildberries facilities between July 18 and August 3, 2026. Regional groupings (Central, North Caucasus, East, Northwest, South, Crimea) are the authors' own categorization for visualization purposes. Strike causation and damage extent at each site have not been independently verified in this summary.
Source: Statements by Russian authorities, as reported August 3, 2026.
Six Reasons Why the United States Is Low on Munitions
The U.S. munitions shortage is not driven by the war with Iran alone. Strategic, industrial, institutional, and operational factors have compounded over three decades to erode the depth of America's arsenal.
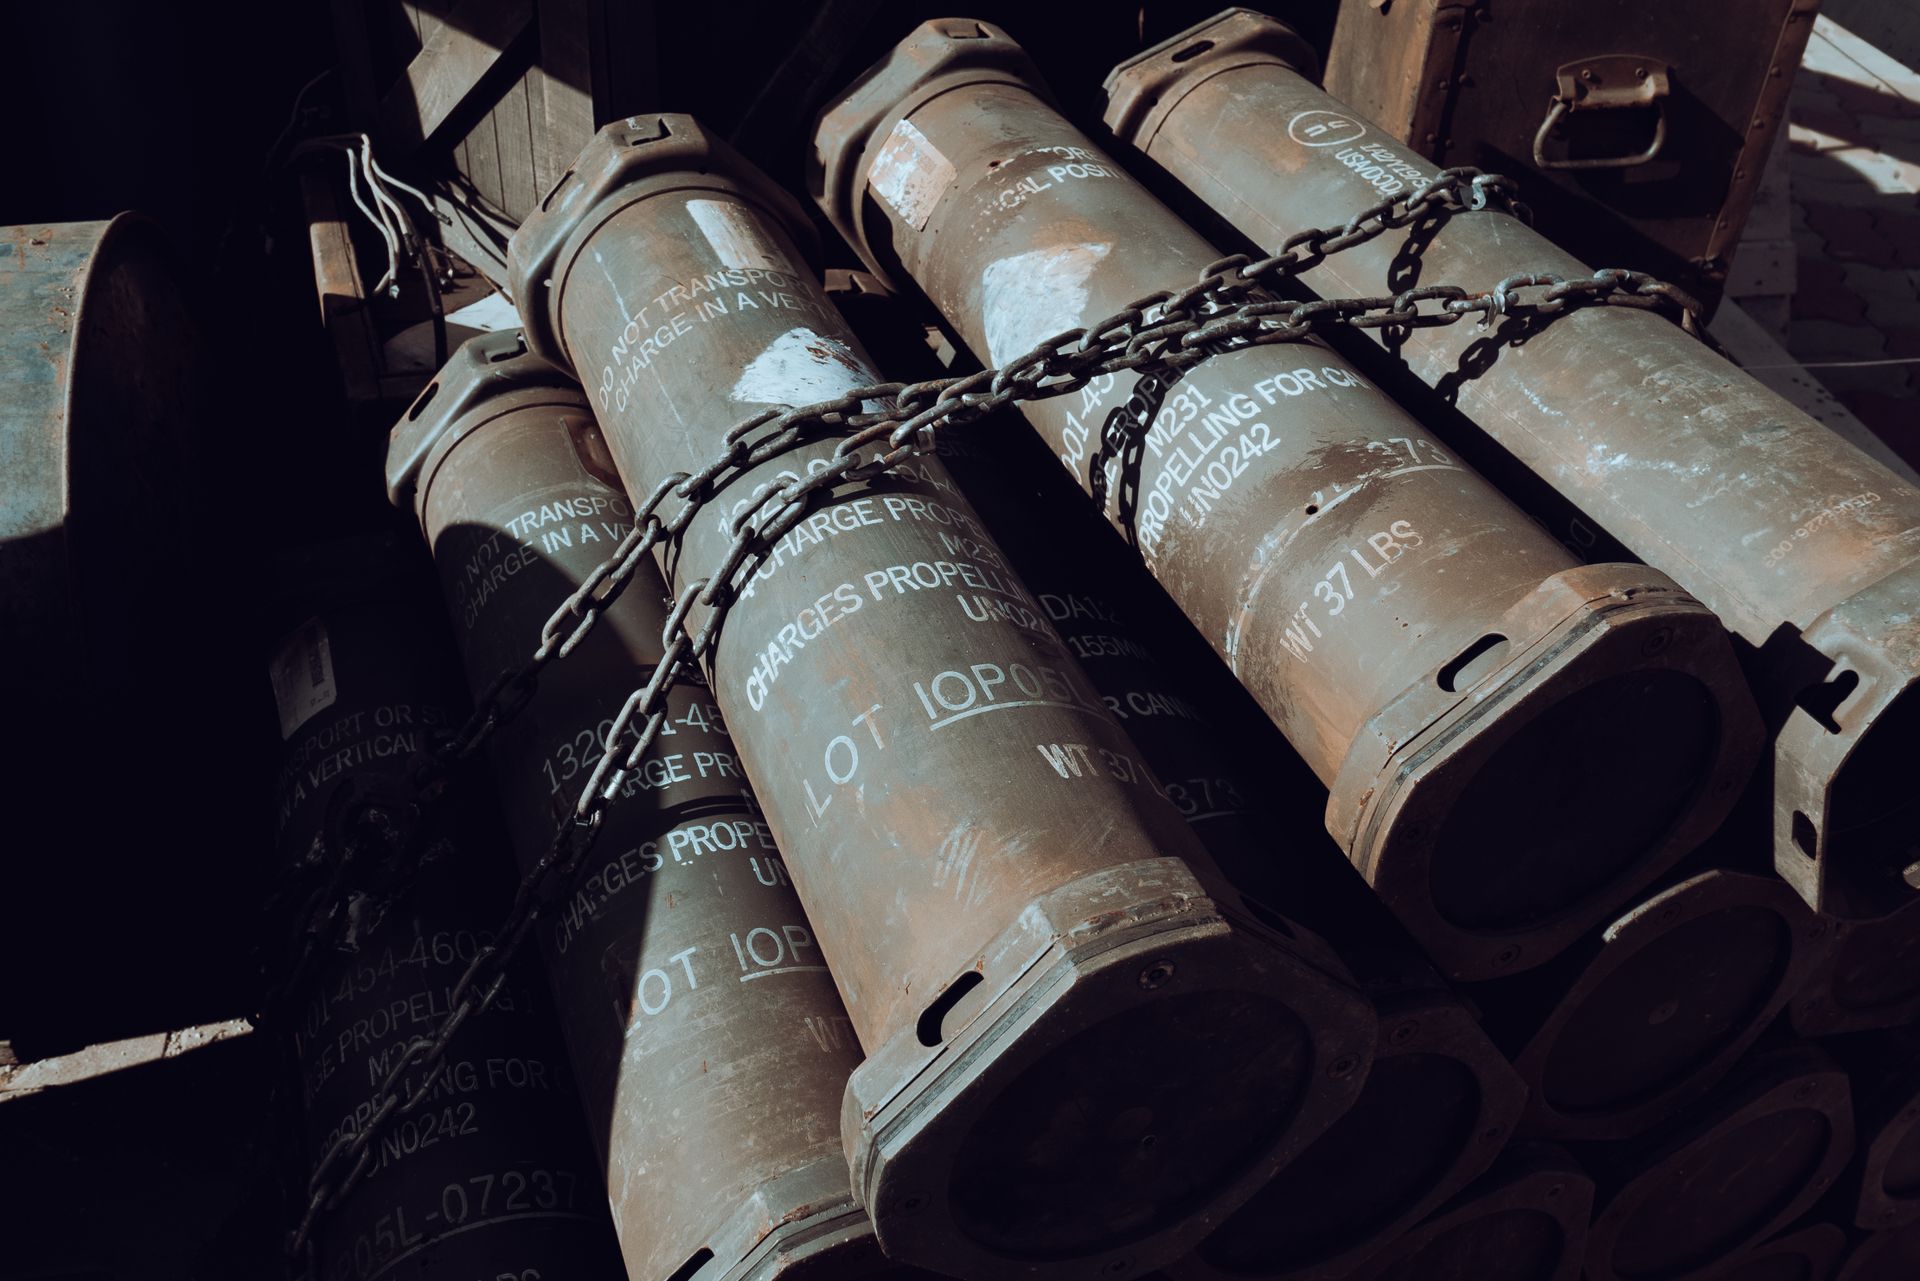
Six Reasons Why the United States Is Low on Munitions
Wartime use against Iran is a major driver, but three decades of strategic shift, industrial consolidation, and budget trade-offs set the conditions long before the current conflict.
Key Judgments
Wartime expenditure against Iran is a significant but not sole driver: roughly half of Patriot, THAAD, and PrSM stocks and about a third of JASSM, SM-2/3/6, and Tomahawk inventories have been used since Operation Epic Fury began.
The 1993 industrial consolidation cut aerospace and defense prime contractors from 51 to 5 and restructured the base for efficient peacetime output, leaving little surge capacity when production needed to expand after 2022.
Munitions structurally compete poorly against platforms such as aircraft and ships in the defense budget process, since platforms offer decades of visible deterrence value while munitions sit unused until a conflict arises.
Middle East operations conducted before the current war — including the campaign against the Houthis and 150 THAAD interceptors fired during the Twelve Day War — had already reduced stockpiles ahead of renewed conflict with Iran.
Transfers to Ukraine are a minor factor overall — only 4 of 102 supplied items are relevant to the Iran war or a China contingency — though transfers of up to 600 Patriot interceptors are the most consequential exception.
Six Drivers of the Shortage
Inventories and Industrial Capacity
Source & methodology. Figures on Patriot, ATACMS, HARM/AARGM, and Stinger inventories and transfers reflect authors' calculations based on FY2027 DOD budget materials and publicly released information; pre-Iran-war and current inventory estimates in this section derive from a distinct baseline and counting method than the companion AHSAM infographic on Patriot and THAAD interceptor depletion, and the two should not be read as directly reconcilable figures.
Source: Adapted from CSIS analysis, "Six Reasons Why the United States Is Low on Munitions," and related CSIS reporting on FY2027 DOD budget materials.
Renewed Iran War Would Test Diminished Interceptor Inventories
Patriot and THAAD interceptor stockpiles have fallen sharply since the prewar baseline, and resumed combat under Operation Epic Fury is drawing them down further — raising hard questions about risk tolerance and readiness elsewhere.

Renewed Iran War Would Test Diminished Interceptor Inventories
Patriot inventories now sit under 1,000 and THAAD near 250, as combat operations resume at a slower — but still costly — pace of Iranian launches.
Key Judgments
The air defense campaign has been largely successful with high, though not perfect, interception rates; some Iranian attacks have gotten through, causing casualties and extensive base damage, but without diminishing U.S. and coalition operations.
Patriot inventories have fallen from 2,330 prewar to 759–827 today, while THAAD has declined from 452 to 234–278 — a reduction driven by heavy use during the first phase of the campaign and continued expenditure since the resumption of combat.
Resumed Iranian launches have so far come at a lower rate than before the ceasefire, but continued attrition of interceptors may still force the United States and its coalition partners to accept greater risk in future engagements.
There are no good substitutes for Patriot and THAAD in ballistic missile defense; Navy ships carrying Standard Missiles are generally positioned too far away to fill the gap.
Sustained expenditure creates a near- to medium-term readiness risk for a potential conflict with China in the western Pacific, a concern reflected in the Trump administration's $95 billion FY2027 munitions request and $21 billion war supplemental.
Interceptor Systems and Strategic Risk
Inventory Decline Over Time
Source & methodology. Estimated inventories today account for additional interceptor use and new deliveries since the April 8 ceasefire. THAAD deliveries during the ceasefire outpaced estimated use over the same period, resulting in higher inventories today than in April. Patriot calculations include the latest MSE variant and PAC-3s; several hundred PAC-2s, not represented in the chart, are estimated to remain in the U.S. inventory.
Source: Authors' calculations based on FY 2027 DOD budget materials and publicly released information. Methodology detailed in Mark F. Cancian and Chris H. Park, "Last Rounds? Status of Key Munitions at the Iran War Ceasefire," CSIS, April 21, 2026.
A Generation at Risk: The Global Convergence on Social Media Age Regulation and Türkiye's Position
AUG 2, 2026
AHSAM Regional Analysts
AHSAM Research & Advisory

Over the past twelve months, at least seven states — Australia, Türkiye, France, Denmark, Norway, Indonesia, and the United Kingdom (at the proposal stage) — have enacted or are advancing age-based restrictions on children's access to social media. This convergence is not the product of isolated national preferences; it reflects a shared risk assessment grounded in a growing body of clinical and epidemiological evidence. The central argument of this assessment is that the current evidence base has crossed the threshold required to justify proportionate, enforceable regulatory intervention, and that the model adopted by Türkiye under Law No. 7578 — combining mandatory age verification, tiered enforcement, and platform accountability — represents a comparatively well-calibrated approach among the cases examined.
Social Media Regulations Aimed at Protecting Children Gain Momentum Across Europe
Sixteen European countries are drafting, debating, or enacting rules restricting children's access to social media and smartphones, with age thresholds converging between 13 and 16.

Social Media Regulations Aimed at Protecting Children Gain Momentum Across Europe
Sixteen European countries are drafting, debating, or enacting rules restricting children's access to social media and smartphones, with age thresholds converging between 13 and 16.
Key Judgments
Age thresholds proposed or enacted across 14 of 16 tracked countries cluster tightly between 13 and 16, pointing to a converging regulatory model rather than isolated national initiatives.
France's requirement that existing under-15 accounts close within four months is the most stringent enforcement mechanism identified, and may serve as a reference model for later movers.
The spread of measures — from an active school phone ban in Poland to early-stage proposals in Germany, Austria, and Latvia — indicates uneven regulatory maturity across the region rather than a coordinated EU-wide rollout.
Greece's scheduled January 2027 ban, set well ahead of most peers' timelines, suggests it could become an early test case shaping the design of later national regulations.
Regulatory Actions by Country
Age Thresholds and Regulatory Stage
Source & methodology. Compiled from public reporting on national legislative and regulatory processes concerning children's social media and smartphone access across Europe. Figures reflect initial public reporting as of early August 2026 and may be revised; this is not an official European Union dataset.
Age-threshold figures reflect the maximum age cited in available reporting for each country; Sweden and Czechia are omitted from the age-threshold chart as their measures target device use in schools rather than a specific age limit.
Nearly 49,000 Irregular Migrants From Morocco Entered Spain's North African Enclave of Ceuta
Moroccan security forces blocked the Ceuta–Fnideq road as irregular crossings surged, and Spain deployed armed forces units to the region.

Nearly 49,000 Irregular Migrants From Morocco Entered Spain's North African Enclave of Ceuta
Moroccan security forces blocked the Ceuta–Fnideq road as irregular crossings surged, and Spain deployed armed forces units to the region.
Key Judgments
The scale of the reported crossing — nearly 49,000 people — represents a significant, concentrated surge rather than a routine irregular-migration flow, given Ceuta's small land area (roughly 18.5 km²).
Morocco's blocking of the Ceuta–Fnideq road, paired with Spain's deployment of armed forces units, indicates a coordinated bilateral response rather than a unilateral Spanish action.
The concentration of crossing points near the coastal boundary, rather than the fenced overland perimeter further inland, suggests attempted maritime and coastal routes played a significant role in this surge.
Melilla's inclusion on the map without reported crossing activity there suggests the surge was geographically concentrated at Ceuta rather than distributed across both Spanish enclaves.
Sequence of Events
Enclaves and Regional Geography
Source & methodology. Compiled from public reporting on irregular crossings into Ceuta and the accompanying Moroccan and Spanish security response. Figures reflect initial public reporting and may be revised; this is not an official Spanish or Moroccan government dataset.
Enclave land-area and distance figures are approximate, standard geographic reference values, included for regional context.
The Technopolitical Order Debate: Rival Visions of AI and Power, and Türkiye's Position
AUG 1, 2026
Cem Atilla SAYGIN
Chief Executive Officer of AEGIS | AHSAM

The source report, issued by Türkiye's National Intelligence Academy under the auspices of its president, Prof. Dr. Talha Köse, argues that the global debate over artificial intelligence has moved decisively beyond questions of technical capability. At stake, in the report's framing, is who will hold authority once AI becomes load-bearing infrastructure for state power, economic hierarchy, and social legitimacy — and how a mid-sized, geographically exposed state such as Türkiye should position itself within that transition.
F-35 Lightning II: An Eight-Year Incident Record
A structured review of fourteen publicly reported F-35 incidents across four operating nations, compiled and assessed in the format of an open-source intelligence briefing, 2018–2026.
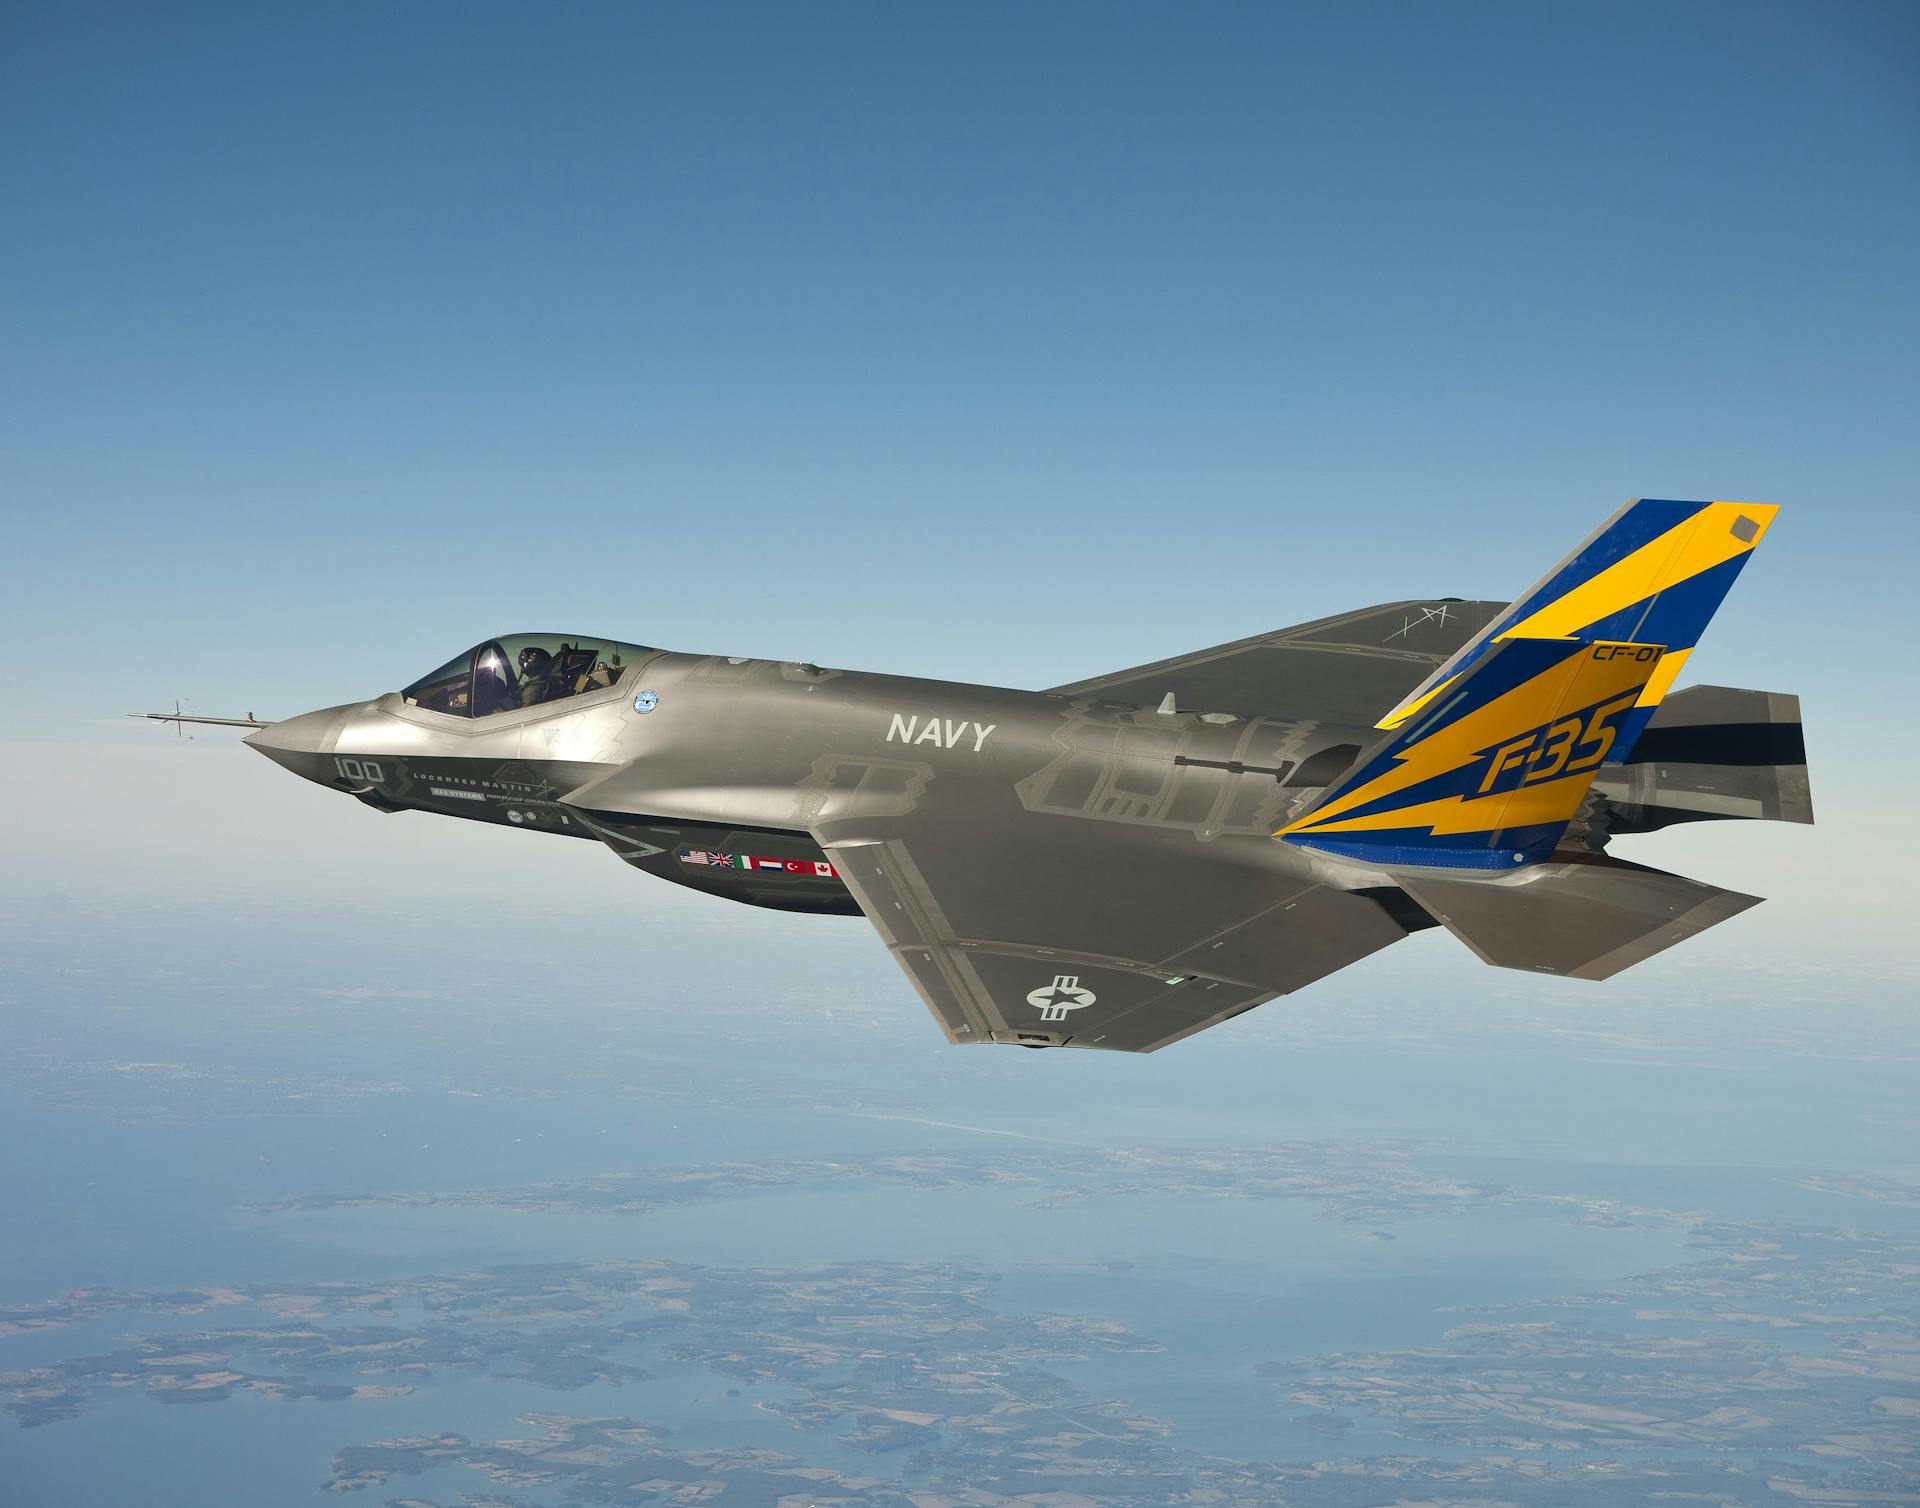
F-35 Lightning II: An Eight-Year Incident Record, 2018–2026
A structured review of fourteen publicly reported F-35 incidents across four operating nations, compiled and assessed in the format of an open-source intelligence briefing.
Key Judgments
The fourteen incidents are distributed rather than clustered across the eight-year period, averaging under two per year — a pattern more consistent with a steady operational baseline than with an accelerating trend.
The concentration of incidents involving U.S.-operated aircraft (11 of 14) most plausibly reflects the scale of the U.S. F-35 fleet — by far the largest of any operator — rather than a disproportionate reliability issue relative to fleet size.
Variant was not publicly specified in 6 of 14 reported cases, which limits confident conclusions about whether the F-35A, B, or C variant is disproportionately represented in this record.
The recurrence of California as an incident location (3 of 14 cases) plausibly reflects the concentration of U.S. test, training, and operational bases in the state — Lemoore, El Centro, and Miramar — rather than a state-specific risk factor.
Incident Timeline
Distribution by Operator and Variant
Source & methodology. Compiled from publicly reported incidents involving F-35 Lightning II aircraft between September 2018 and July 2026. This assessment reflects aggregate incident counts drawn from open-source reporting only; it is not an official U.S. Department of Defense, Lockheed Martin, or partner-nation dataset, and does not constitute a technical safety or airworthiness determination.
Confidence levels reflect the strength of the underlying pattern in the available data, not certainty of outcome, following standard analytic-confidence conventions used in intelligence and strategic-risk reporting.
Why Türkiye is boosting ties with both sides in Libya

AUG 1, 2026
Ferhat Polat
The writer is a senior researcher and analyst specializing in North African geopolitics and security

Türkiye's outreach to the east complements rather than competes with its ties to Tripoli. This approach is part of a consistent effort to keep channels open with all actor capable of shaping the country's political future.
Evaluation of German government: Reshuffles, reforms, and far-right threat

JULY 31, 2026
Ulrich Schließung
Henry Kissinger Professor at University of Bonn and Joint Research Professor at University of St. Andrews.

Friedrich Merz acting wisely and skillfully on the international stage is an asset that benefits Germany as a whole; however, against a backdrop of growing strategic uncertainties, it does not appear sufficient to bring a fundamental turnaround
The strategic dimensions of Iraqi Premier Al-Zaidi's upcoming visit to Türkiye

JULY 31, 2026
Ahmed Al-Jumaili
Researcher at the Nahrain Center

The visit of Iraqi Prime Minister Ali al-Zaidi to Ankara on Tuesday, July 28, 2026, during which he is scheduled to meet Turkish President Recep Tayyip Erdogan, will mark the third stop in a series of foreign visits since he took office.
Targeted Facilities of Russia's Largest E-Commerce Company, Wildberries
Ukraine continues targeting Russia's Wildberries facilities, with drone strikes hitting sites in the Penza region and the Republic of Udmurtia, according to the online retailer.

Targeted Facilities of Russia's Largest E-Commerce Company, Wildberries
Ukraine continues targeting Russia's Wildberries facilities, with drone strikes hitting sites in the Penza region and the Republic of Udmurtia, according to the online retailer.
Key Judgments
The geographic spread of targeted sites — from St. Petersburg in the northwest to Crimea in the south — indicates a deliberate campaign against Wildberries' national distribution network rather than a strike on a single facility.
Targeting a major e-commerce logistics operator fits a broader pattern of strikes aimed at Russian economic and logistical capacity away from the front line, rather than a purely military objective.
The inclusion of Simferopol (Crimea) alongside mainland Russian sites suggests the campaign treats occupied Crimea as part of an integrated target set rather than a separate theater.
The absence of reported strikes on Wildberries facilities in Moscow itself may reflect denser air-defense coverage around the capital rather than an intentional exclusion from the campaign.
Facilities Targeted, July 22–30
Distribution by Region and Proximity to Ukraine
Source & methodology. Compiled from Wildberries' own public statements and open-source reporting on strikes between July 22–30, 2026. This assessment reflects the company's disclosed facility list only; it is not an official Russian or Ukrainian government dataset, and does not confirm the extent of damage or operational impact at each site.
Distance categories are approximate and illustrative, intended to convey the geographic reach of the campaign rather than precise strike-planning data.
The Kalkınma Yolu Project: Reading Türkiye's Regional Diplomatic Capacity Through Infrastructure

JULY 30, 2026
AHSAM Regional Analysts
AHSAM Research & Advisory

This article examines the Kalkınma Yolu (Development Road) Project — a multimodal transport corridor linking Iraq's Al-Faw Port to European markets via Türkiye — as a case through which to interpret Türkiye's regional diplomatic capacity. Since the signing of a multilateral Cooperation Memorandum among Türkiye, Iraq, the United Arab Emirates, and Qatar, the project has progressed to an engineering design phase reported at approximately 90% completion, coinciding with an intensification of high-level Turkish-Iraqi contact culminating in a state visit by the Iraqi Prime Minister to Ankara on 28 July 2026. This analysis employs an interpretive policy-analytic approach, treating the observed correspondence between diplomatic engagement and technical progress not as proof of causation but as evidence consistent with the broader claim that Türkiye functions as a regional actor capable of translating diplomatic capital into infrastructural outcomes.
Airbus Sets World Record for Longest Flight by a Commercial Aircraft
Airbus A350-1000ULR sets a commercial airliner distance record by flying 23,075.92 km in 24 hours and 24 minutes.

Airbus Sets World Record for Longest Flight by a Commercial Aircraft
Airbus A350-1000ULR sets a commercial airliner distance record by flying 23,075.92 km in 24 hours and 24 minutes.
Key Judgments
The new record reflects incremental gains in ultra-long-range aircraft efficiency (A350-1000ULR) rather than a fundamentally new aviation technology.
Because the flight followed a test/delivery-style routing (Melbourne → Toulouse) rather than scheduled passenger service, it demonstrates technical capability more than immediate commercial route viability.
The 21-year gap since the previous record (2005, Boeing 777-200LR) suggests record-distance flights of this kind are rare, deliberate technical demonstrations rather than a routine occurrence.
A margin of roughly 7% farther than the previous record is meaningful but not transformative — consistent with an evolutionary, not revolutionary, advance in commercial aircraft range.
Timeline of the Record
Route and Duration Comparison
Source & methodology. Compiled from Airbus's public announcement of the July 28–29, 2026 record flight. Figures reflect the manufacturer's disclosed distance and duration; independent ratification of the record by international aviation bodies (e.g., the Fédération Aéronautique Internationale) may follow separately.
This assessment is not an official regulatory or air-traffic-control dataset.
Türkiye’s Enforcement Standards
JULY 28, 2026]
AHSAM Regional Analysts
AHSAM Research & Advisory

This AHSAM report (28 July 2026) offers a comparative evaluation of Türkiye’s multi-layered institutional model for combating money laundering, illicit drug trafficking, terrorist financing, illegal gambling, and crypto-asset offences , benchmarking domestic practice against standards set by FATF, Europol, UNODC, and Chainalysis. Findings indicate that Türkiye’s financial intelligence unit, MASAK, plays a central analytical role, working alongside law enforcement and public prosecutors in a coordinated investigative structure.
Britain's new Premier Andy Burnham and the multipolar political era

JULY 24, 2026
Klaus Jürgens
Director of Economyfirst Limited London

The British political system is, thus, not broken, it has simply transformed from a bipolar to a multipolar system. But stability is still lacking, which explains the revolving door at No. 10.
Japan Issues Tsunami Alert After Strong Quake in Southwestern Japan
6.8-magnitude earthquake hits Kumamoto Prefecture in southwestern Japan. Authorities issue a tsunami advisory for Ariake and Yatsushiro seas and urge residents to evacuate coastal areas.

Japan Issues Tsunami Alert After Strong Quake in Southwestern Japan
6.8-magnitude earthquake hits Kumamoto Prefecture in southwestern Japan. Authorities issue a tsunami advisory for Ariake and Yatsushiro seas and urge residents to evacuate coastal areas.
Key Judgments
A shallow depth (10 km) at this magnitude increases the likelihood of strong shaking near the epicenter, consistent with the tsunami advisory issued for the adjacent Ariake and Yatsushiro seas.
The advisory-level (rather than warning-level) response suggests authorities assessed the tsunami risk as elevated but not catastrophic, based on the quake's shallow, semi-enclosed coastal geometry.
Kumamoto Prefecture's history of seismic activity, including the 2016 Kumamoto earthquake sequence, likely informed a rapid, practiced evacuation response from local authorities.
Limited early reporting on casualties or structural damage is more likely a function of the short time elapsed since the event than an indication of minimal impact.
Sequence of Events
Geographic and Historical Context
Source & methodology. Compiled from initial public reporting on the earthquake and subsequent tsunami advisory. Magnitude, depth, and affected-sea data reflect early public reporting and may be revised as the assessment is updated; this is not an official Japan Meteorological Agency dataset.
Distances from the epicenter are approximate, based on general geographic proximity between the listed prefectures and Kumamoto.
July 15: A Coup Defeated

JULY 15, 2026
Cem Atilla SAYGIN
Chief Executive Officer of AEGIS | AHSAM

This analysis examines the July 15, 2016 coup attempt through an institutional and strategic lens, a decade after the event. Reconstructing the operational chronology of the attempt by Fethullahist Terrorist Organization (FETÖ)–aligned military elements, the paper identifies the decisive role played by civilian resistance and cross-partisan political consensus in its defeat.
NATO releases new strategy for industry cooperation

JULY 8, 2026
NATO PRESS OFFICE
North Atlantic Treaty Organization

On Wednesday (8 July 2026), NATO released its new Strategy for Industry-NATO Cooperation (SYNC) after it was endorsed by Allied Heads of State and Government at the NATO Summit in Ankara. SYNC upgrades NATO’s framework for working with industry and reflects the growing role of industry in strengthening the Alliance’s deterrence and defence. It sets out three main objectives: enhancing communication and collaboration with industry; advancing innovation and interoperability; and strengthening, scaling and sustaining defence production across the Alliance. The strategy aims to improve industry’s access to NATO; provide greater visibility of Allied capability needs; and simplify engagement with NATO for companies of all sizes, including small and medium-sized enterprises (SMEs) and non-traditional suppliers. A detailed implementation plan will now be developed in close cooperation with industry.
Secretary General on the Ankara Summit: NATO delivers
JULY 7, 2026
NATO PRESS OFFICE
North Atlantic Treaty Organization

The NATO Summit in Ankara concluded on Wednesday (8 July 2026). Secretary General Mark Rutte said the message from Ankara was clear: NATO delivers. He explained how defence investment was rising, new capabilities are being delivered, defence industrial production is expanding, and that European Allies and Canada are assuming greater responsibility for their security. “We are rebalancing our security for the better, and that is what NATO 3.0 is all about,” he said. The Secretary General highlighted the significant progress already made towards investing 5% of GDP in defence by 2035, with total defence and security spending already measuring around 4% just one year into the 10-year effort. “Our focus has now shifted decisively from setting targets to delivering results,” Mr Rutte said. “That means accelerating production, breaking down barriers, boosting resilience, investing in innovation, and working with partners to maximise cooperation.” The Summit underlined the growing importance of working with industry in strengthening NATO’s deterrence and defence. At the NATO Summit Defence Industry Forum, governments and industry announced major new commitments, including over EUR 50 billion in new procurement deals. Allies also launched NATO’s Drone Edge, a major new initiative that will see USD 40 billion invested in counter uncrewed systems over the next five years. Mr Rutte also announced a historic step to enhance NATO’s fuel supply chain, helping ensure Allied forces have the energy supplies they need for warfighting readiness. “We know that this 27-billion-euro investment will modernise our existing fuel storage and distribution infrastructure and support new facilities including pipelines towards the eastern part of the Alliance,” he said. Allies also reaffirmed NATO’s unwavering support for Ukraine, pledging to provide at least EUR 70 billion in military equipment, assistance and training for Ukraine this year and again next year. The Secretary General said NATO will continue to ensure Ukraine gets what it needs as Russia continues to wage its brutal war. The Secretary General highlighted Alliance unity. “Here in Ankara, Allies reaffirmed their ironclad commitment to the collective defence under Article 5, that an attack on one is an attack on all, and we will stand together,” said Mr Rutte, “Our unity, solidarity, and collective strength remain the foundation of peace, security, and prosperity.”